An index investor holds for decades and lets a published rule make the calls. A trader shortens the horizon and makes those calls themselves. The first hands the decisions to someone else. The second has to earn the right to make them.
Foundations of Investing ends on how each one earns. Investing earns from ownership: you hold productive businesses, they generate profits across years, and the return arrives whether or not you were clever. Trading earns from being right about price over horizons too short for business performance to do much of the work. Investing has a tailwind. Trading has a cost base and an opponent.
Both put money into a symbol, hold it and take it out. What separates them is the horizon, where the return comes from, and who decides.
Trading still comes fourth#
If you are 22 and just read Foundations, keep doing what it says. Earn, save 15%, own broad index funds, and leave them alone. Trading comes after those three run without your attention, and the order holds.
Start with the arithmetic. Someone with $8,000 saved who doubles it through brilliant trading gains $8,000. Raising a savings rate from 8% to 15% of a $60,000 salary adds $4,200 a year, every year, with no skill and no chance of ruin. At 22, the savings rate is the better trade.
Trading also needs capital set apart. The Keel works through the sizing: a setup that risks $300 a trade needs a $30,000 account to keep that risk at 1%, and that $30,000 sits outside your emergency fund and your retirement accounts. Few people have that in their twenties. That is fine. It is a good decade to learn the skill.
Every investor is already a trader#
An S&P 500 index fund buys and sells stocks regularly. Its owner never places those trades.
Two parties make the decisions. The S&P U.S. Index Committee decides which companies are in the index, under a published methodology. The fund makes the trades that keep it tracking the index: buying what comes in, selling what goes out, adjusting at each quarterly rebalance. Tesla joined the S&P 500 before the open on December 21, 2020. On Friday, December 18, the last session before it joined, Tesla traded 222 million shares, about four times the volume of the sessions either side.
The weighting rule decides something too. In a cap-weighted index, a rising stock becomes a larger share of the fund and a falling one a smaller share, without the fund trading a single share. A stock that falls far enough eventually leaves the index and is sold. The effect works like let winners run and cut losers, applied over years, with no one choosing the moment.
So the index investor is a trader on a long horizon who has handed the decisions about individual stocks to a methodology and the fund that carries it out. Their own decisions are three: how much to put in, when to start, and to leave it alone. Foundations argues those three are the right ones for nearly everyone's first decade, and it is right.
A trader takes the decisions back. Which symbol, which direction, how much, when to get in and when to get out are all theirs. The horizon shrinks from decades to weeks, days or minutes.
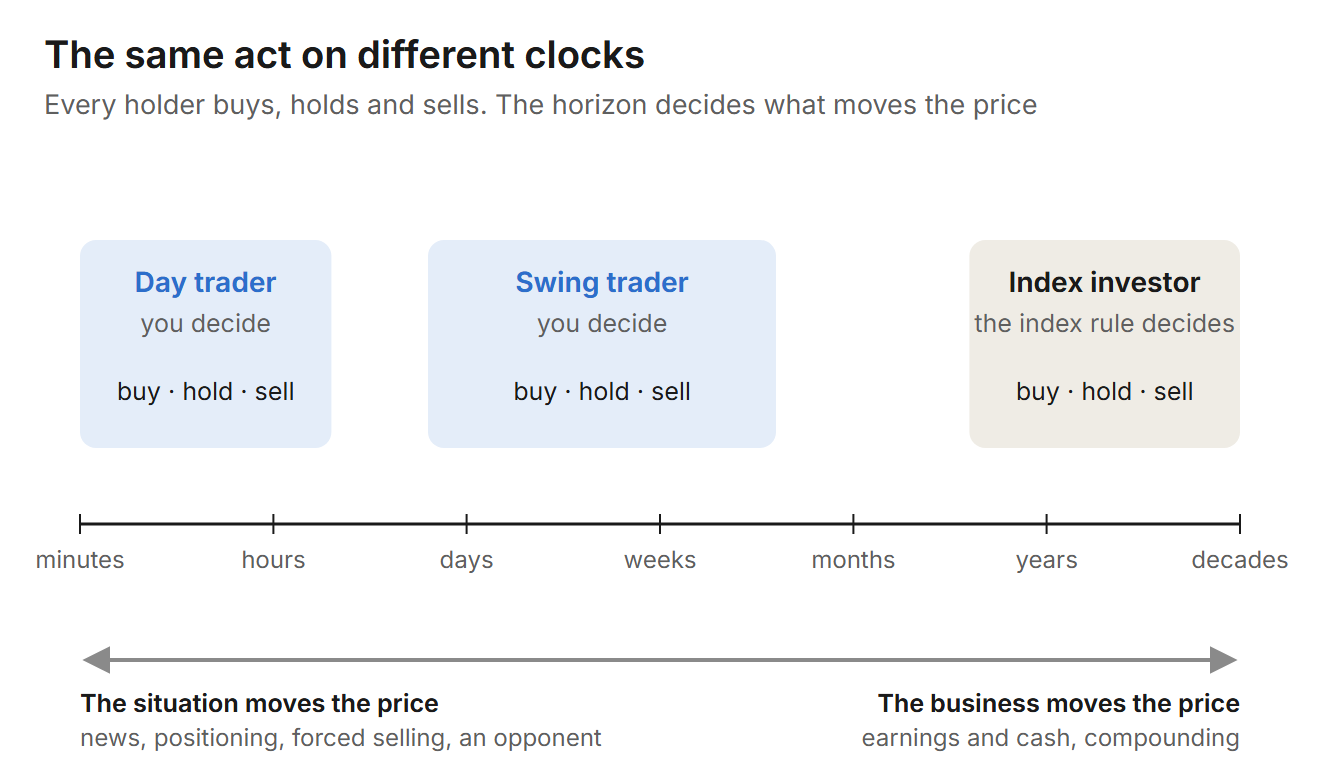
The same act on different clocks
What a short horizon cannot use#
Business results arrive slowly. Earnings are reported four times a year. A company compounding its earnings at 15% a year grows them by about 0.6% over ten trading sessions, if the growth runs smoothly.
Prices move on more than earnings. They move on what investors expect next, on what they are willing to pay for those expectations, and on new information every day. Over the year to October 16, 2026, NVDA had five separate ten-session stretches in which it rose between 10% and 19%. The business did not grow that much in two weeks. Each move was a situation: a reaction to news, money rotating into a theme, positions being built or unwound, a crowd arriving at once.
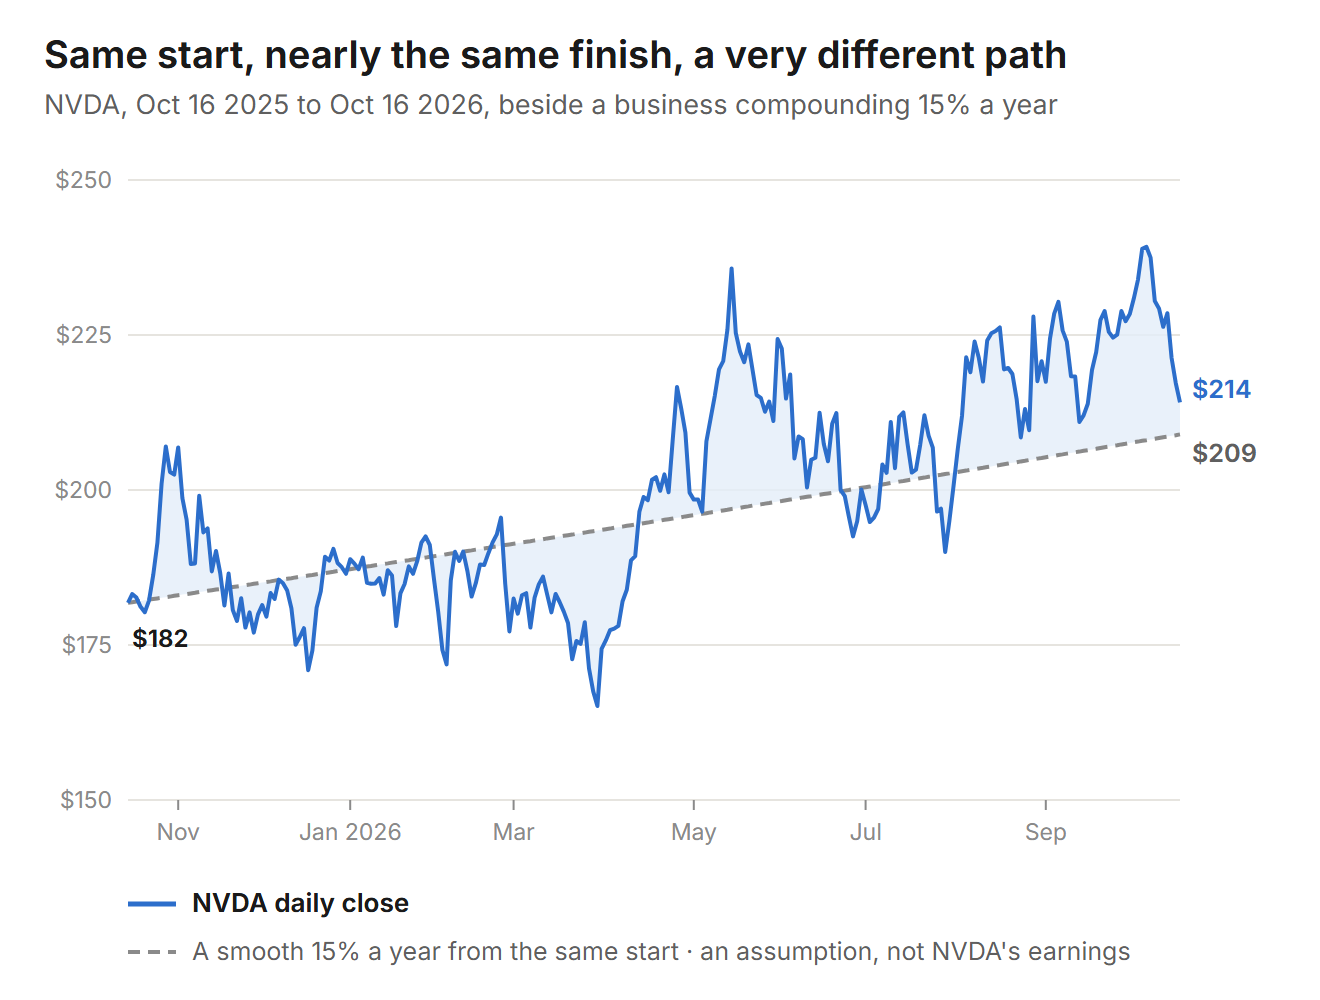
NVDA daily closes, Oct 16 2025 to Oct 16 2026 · the dashed line is an assumption for comparison
That gap is the trader's territory: the difference between what the business is doing and what the price is doing this week. Leverage Works Both Ways showed how wide it gets. On October 5, a UBS analyst kept a $330 target on Cerebras. Nine sessions later the stock closed at $127.21. The analyst may yet be right about the business. Over those nine sessions the price did not care.
The opponent#
Over decades, two investors on opposite sides of a trade can both do well. The business grows, and the seller puts the cash into another business that grows.
Over ten sessions there is little time for business growth to explain the result. What you earn depends on how the price moves against your expectation, minus what you pay to trade. Every order has someone on the other side: a market maker earning the spread from you, a fund with more research, an algorithm that reacts in microseconds, another trader reading the same chart. After costs, active traders as a group start behind.
Professionals can make money with a smaller edge than you can. They pay less per trade, get filled faster and trade thousands of times a year, so a small statistical advantage, repeated, becomes a business. A retail trader pays more per trade and takes far fewer of them. The same small advantage can vanish into the costs.
The record shows how the contest goes for the unprepared:
- Taiwan, 1992–2006. Under 1% of day traders earned predictable profits net of fees (Barber, Lee, Liu and Odean).
- Brazil, 2013–2015. 97% of those who day-traded equity futures for more than 300 days lost money (Chague, De-Losso and Giovannetti).
- India, FY2022–FY2024. 93% of individual equity-derivatives traders lost money (SEBI).
That is the base rate a new trader starts from.
In for the move, out for the chop#
Here is the working definition. Trading is putting capital at risk in a symbol for a short time, when a directional move is highly likely, and then getting out and protecting that capital from the chop.
Prices travel far to get anywhere. Add up every daily move over the year to October 16, 2026, ignoring direction, and set it beside where the price ended:
| Symbol | Net change for the year | Daily moves added up | Movement per point of net change |
|---|---|---|---|
| SPY | +15.5% | 154% | 10 |
| QQQ | +18.3% | 242% | 13 |
| AAPL | +38.8% | 278% | 7 |
| NVDA | +17.8% | 467% | 26 |
The last column divides the third by the second. It measures how much movement came with the result. It is no measure of what a trader could have made.
Now split NVDA's year in two. Take its five largest ten-session moves, chosen by size, largest first, with no two overlapping. They cover 50 sessions, and the daily changes inside them compound to 107%. The daily changes in the other 201 sessions compound to −43%. All 251 together give the year's 17.8%.
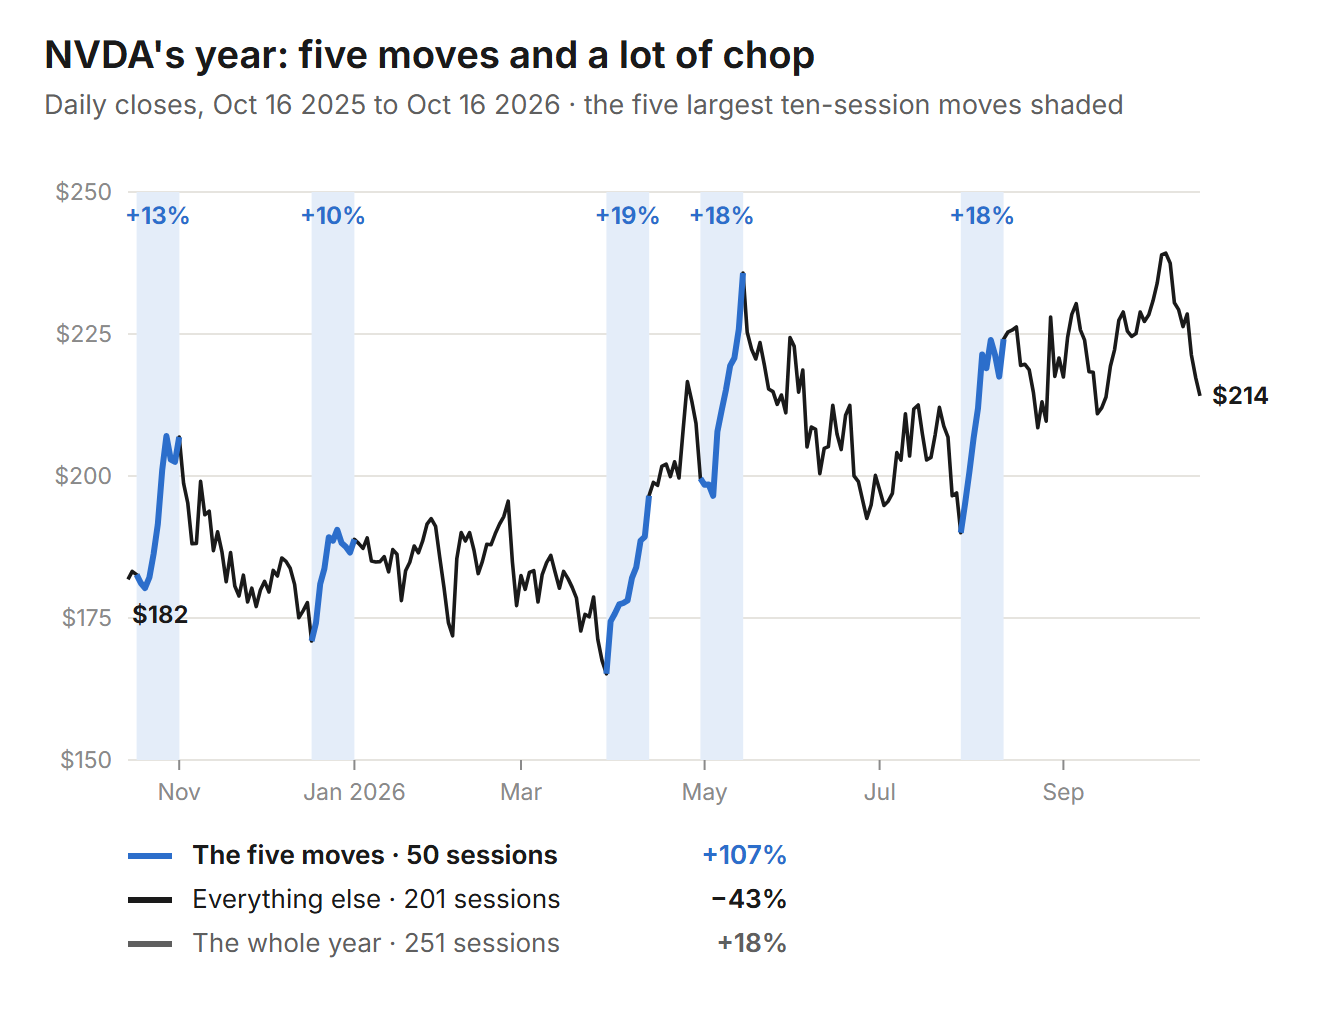
NVDA daily closes, Oct 16 2025 to Oct 16 2026 · the five largest non-overlapping ten-session moves, chosen after the fact
The split describes the price path. Nobody could have traded it: the windows were chosen after they happened, and on March 30 nobody knew the next ten sessions would add 19%. The trader's craft is raising the odds of being in a window like that before it happens, and getting out when the move stalls.
The investor can afford the chop. Over decades it averages out, and the business grows underneath it. A trader on a ten-session horizon has no such cushion. A trader who keeps entering while a stock chops pays the spread and the commission on every round trip, and the stops that protect each position get hit one after another, each a small loss. In the chop, an active account loses money even when the price ends the month where it started.
Getting out is half the trade#
An entry is a guess about direction. The exit is what protects the capital.
Every trade needs two exits written down before you enter. The first is where you are wrong: the price at which the move you expected has failed, and you take the small loss. The second is where you are done: the target, or the number of sessions after which a move that has not started is no longer the move you entered for.
A trader without the first exit holds losers into the chop. A trader without the second gives back the move while waiting for more. Both turn a short-horizon trade into a long-horizon holding of a single stock, with none of the index's diversification and none of its rules.
A skill worth building, slowly#
Trading takes a separate pool of capital, a written method, a record of every trade, and years of being mediocre while you learn. Treat it as a profession with an unpaid apprenticeship. Anyone promising a shortcut is selling something.
It is also a skill worth having. The person who learns to read price, size a position and accept a small loss without abandoning the method has a discipline that outlasts any one market. And a trader who understands what the index committee does on their behalf makes a calmer index investor.
Learning costs little. Losing money costs a lot. Keep the two apart:
- Learn without risking money. Study price action, work through past sessions, and journal the trades you would have taken and why, with realistic costs included.
- Test a written method. Fixed rules for entry, exit and size, tried on replays or on paper over many trades. Paper tests the process. It cannot reproduce live fills or the pressure of a real loss.
- Risk only what you can lose. Keep the trading capital separate, start at the smallest size your broker allows, and set the drawdown at which you stop, as The Keel works through.
- Scale slowly. Increase size only after a large number of live trades shows an advantage after costs, with drawdowns you can live with. A good year is evidence to examine. It can still be luck.
Before each trade, at any size, write down five things:
- The symbol and the direction.
- Why now. The situation that makes a directional move likely over the next few sessions.
- Where you are wrong. The price that ends the trade.
- Where you are done. The target, or the number of sessions you will wait.
- The size. Worked out from the first exit, never picked. Divide the dollars you are willing to lose by the distance from entry to stop. $300 at risk with the stop $3 below the entry is 100 shares. If the stop has to sit $6 away, it is 50.
If you cannot fill in the second line, you do not have a trading setup. You have a short-term opinion about a stock. Leave the money in the index fund, where the committee does the work, and keep building the foundation that trading comes after.
An investor rents the index committee's judgment. A trader has to bring their own.
On the numbers. Prices are daily closes from October 16, 2025 to October 16, 2026: 252 closes, 251 daily changes. "Daily moves added up" is the sum of the absolute daily percentage changes; the last column of that table divides it by the net change. The five NVDA windows each span eleven closes and ten daily changes; every such stretch was ranked by the absolute size of its change, and windows were taken largest first, skipping any that shared a close with one already taken. All five turned out to be rises. The 107% compounds the 50 daily changes inside them and the −43% compounds the other 201. Neither is a return anyone could have earned. The 0.6% figure is 15% annual growth scaled to ten of 252 sessions, and the dashed line in the second chart grows 15% a year from the October 16, 2025 close; both are assumptions for comparison, not NVDA's earnings. Tesla's volume is from daily data. The day-trading studies are cited in full in Foundations of Investing. The Cerebras figures are from Leverage Works Both Ways.