A cruising sailboat carries a few thousand pounds of lead bolted under the hull. On a still morning at the dock that lead is dead weight. It slows the boat, and you paid to haul it around.
Then a gust comes across the water. The sails load up, the boat heels, and the keel swings out to windward. The further she leans, the harder the lead pulls her back upright. A boat with a heavy keel and a sensible amount of sail rounds up, spills the wind and carries on. A boat carrying more sail than its keel can answer gets knocked flat.
Your account balance is the keel. The dollars you risk on each trade are the sail. A losing streak is the gust. Leverage, as Leverage Works Both Ways showed on Cerebras, is more sail on the same keel.
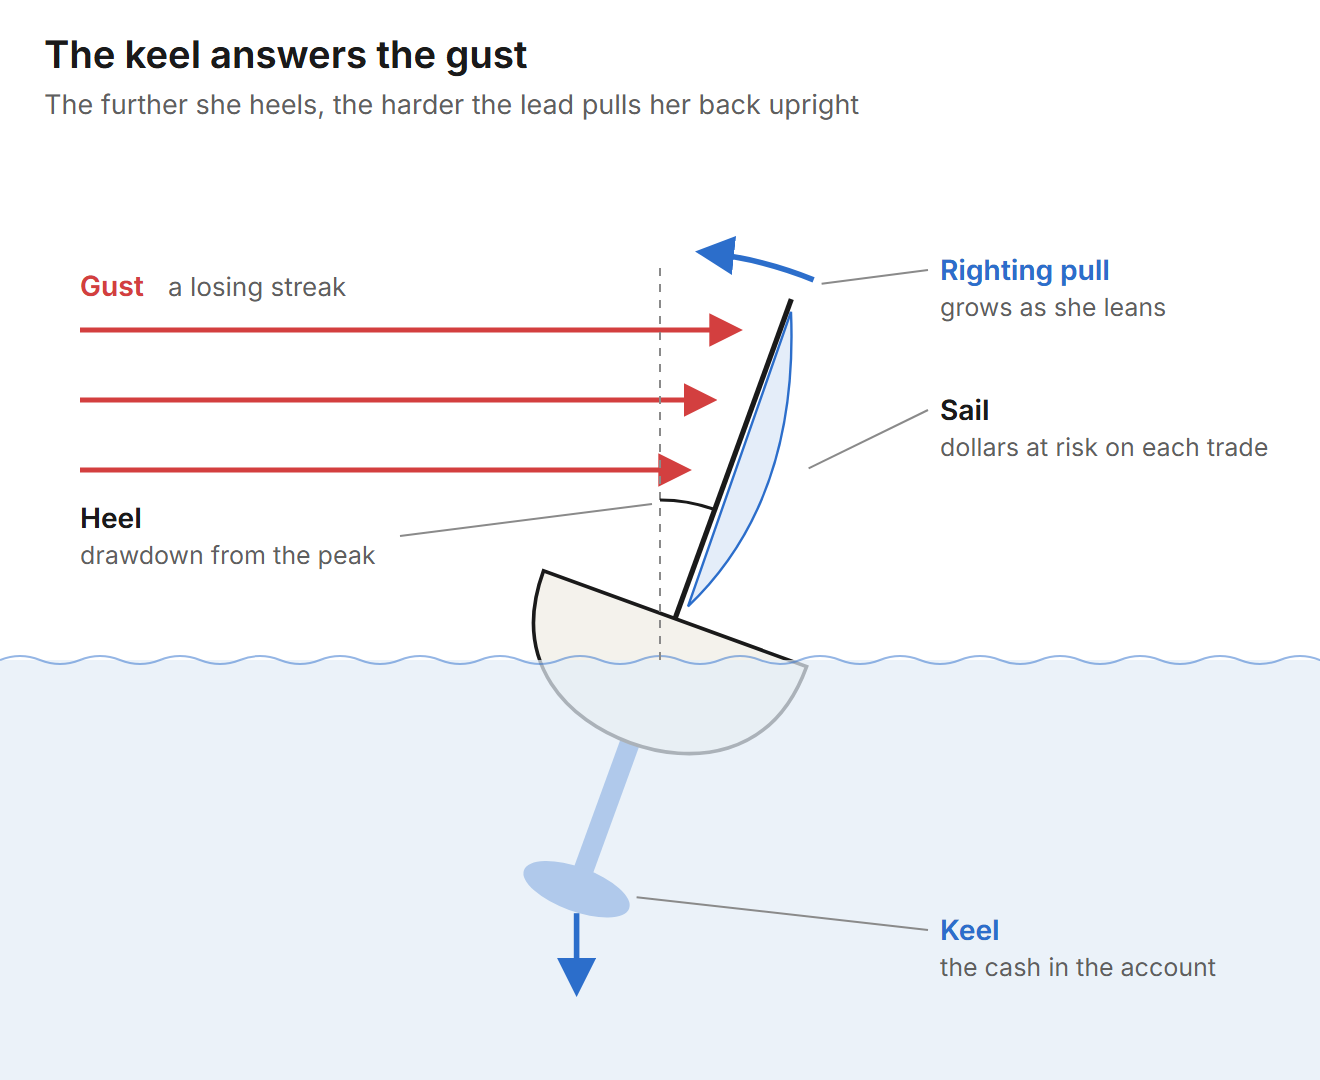
The metaphor, labeled
You will meet the gust#
Losing streaks are arithmetic. Every trader who runs a system long enough meets one, including traders whose systems make money.
Take the kindest case: every trade independent of the last, a fixed win rate, 200 trades. Here is the chance of at least one losing run of a given length somewhere in those 200.
| Win rate | 6 losses in a row | 8 in a row | 10 in a row | 12 in a row |
|---|---|---|---|---|
| 50% | 80% | 32% | 9% | 2% |
| 40% | 99% | 75% | 38% | 15% |
A trader who wins 40% of the time will almost certainly see six straight losses, and three times in four will see eight. That is a weighted coin flipped 200 times, with no bad luck added. Real trades are not independent. When the market changes character, several setups fail in the same week, and the runs grow longer than the table.
Plan for the right-hand columns. The worst streak you have lived through so far is the shortest one still coming.
Ballast goes in at the dock#
Nobody fits a keel in a squall. The cash that carries you through a losing run has to be in the account before the run starts.
Money you will need for rent, tuition or a car payment is cargo. When a losing month arrives and the rent is due, that money comes out of the account at the bottom of the streak. The keel shrinks in the middle of the gust, and the next trade is sized off a smaller balance with the same sail still up.
Fund the account with money you will not need for at least a year, and keep living expenses somewhere else. Until you can do both, trade smaller.
Account size, risk unit, maximum drawdown#
Three numbers decide whether the boat stays upright, and they fix one another.
Account size is the cash in the account. The risk unit is the dollars you lose on one trade when the stop is hit: account size times your risk per trade. The maximum drawdown is the peak-to-trough loss at which you stop trading. Call it 20% for now.
With a 20% limit, the risk per trade decides how many straight losses you can take before you reach it:
| Risk per trade | Drawdown after 10 straight losses | Straight losses to reach 20% |
|---|---|---|
| 0.5% | 4.9% | 44 |
| 1% | 9.6% | 22 |
| 2% | 18.3% | 11 |
| 3% | 26.3% | 7 |
| 5% | 40.1% | 4 |
Read it beside the streak table. At 2% a trade, one ten-loss run puts you at the line. At 1% you can take two. At 5%, the six-loss run that a 50% system meets four times in five takes you past it.
Account size enters through the dollars your setups need. Say your setups put the stop $3 below the entry on a $100 stock, and a trade is only worth taking at 100 shares. That is $300 at risk on every trade. In a $30,000 account it is 1%, and you have twenty-two straight losses to the line. In a $10,000 account it is 3%, and you have seven. The setup is the same. The keel is a third the size.
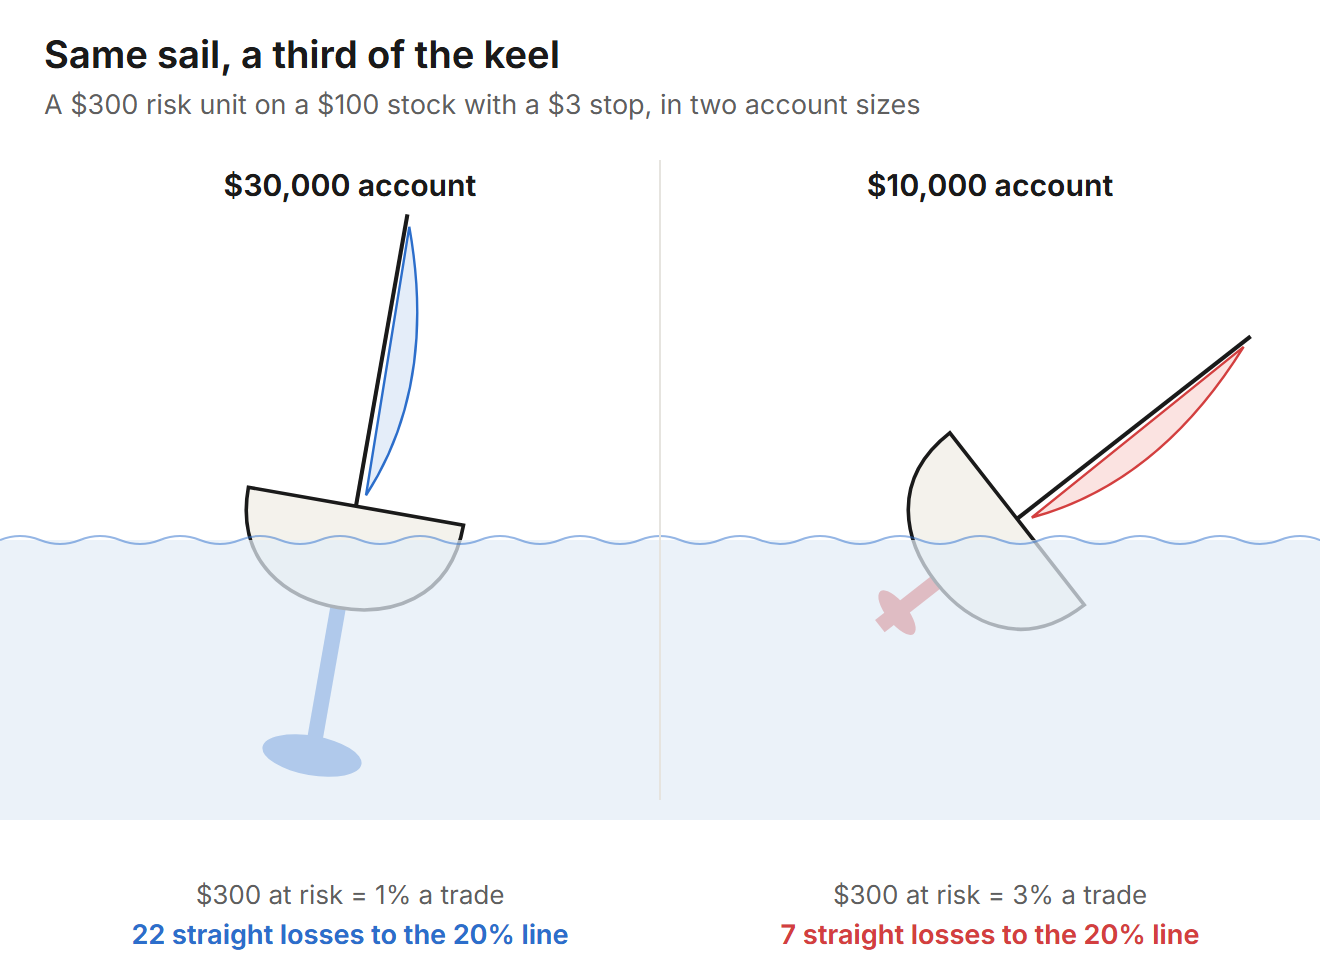
$300 at risk on a $100 stock with a $3 stop
Start at 1% or less. If your setups need more than 1% of the account to be worth taking, the account is too small for them. Add cash, or trade setups with tighter stops, before you trade them at full size.
Pick the angle where you turn for the harbor#
Every sailor has a point where they stop pressing on and head in. Pick yours at the dock. A decision made at thirty degrees of heel with water over the rail is a bad one.
For a trader that point is a peak-to-trough drawdown, and 20% is the absolute maximum. When the account reaches it, you stop trading. You go back to the system: compare the recent trades with its tested record, check whether you followed it, and find out whether the market it was built for still exists. You come back when you have an answer, and you come back smaller.
Peak-to-trough is measured from the highest close the account has made. The deposit does not enter into it. An account funded with $50,000 that grows to $62,000 and then falls to $51,000 is still up on the deposit, and it is 17.7% below its peak, three points from the line. A trader watching the deposit thinks they are fine.
Track it at every close. One line per session:
| Date | Closing balance | Peak to date | Drawdown |
|---|---|---|---|
| Oct 14 | $61,200 | $62,000 | 1.3% |
| Oct 15 | $58,900 | $62,000 | 5.0% |
| Oct 16 | $55,300 | $62,000 | 10.8% |
Drawdown is 1 minus the closing balance divided by the peak. It takes thirty seconds after the close. A trader who looks only after a bad week finds the line already behind them.
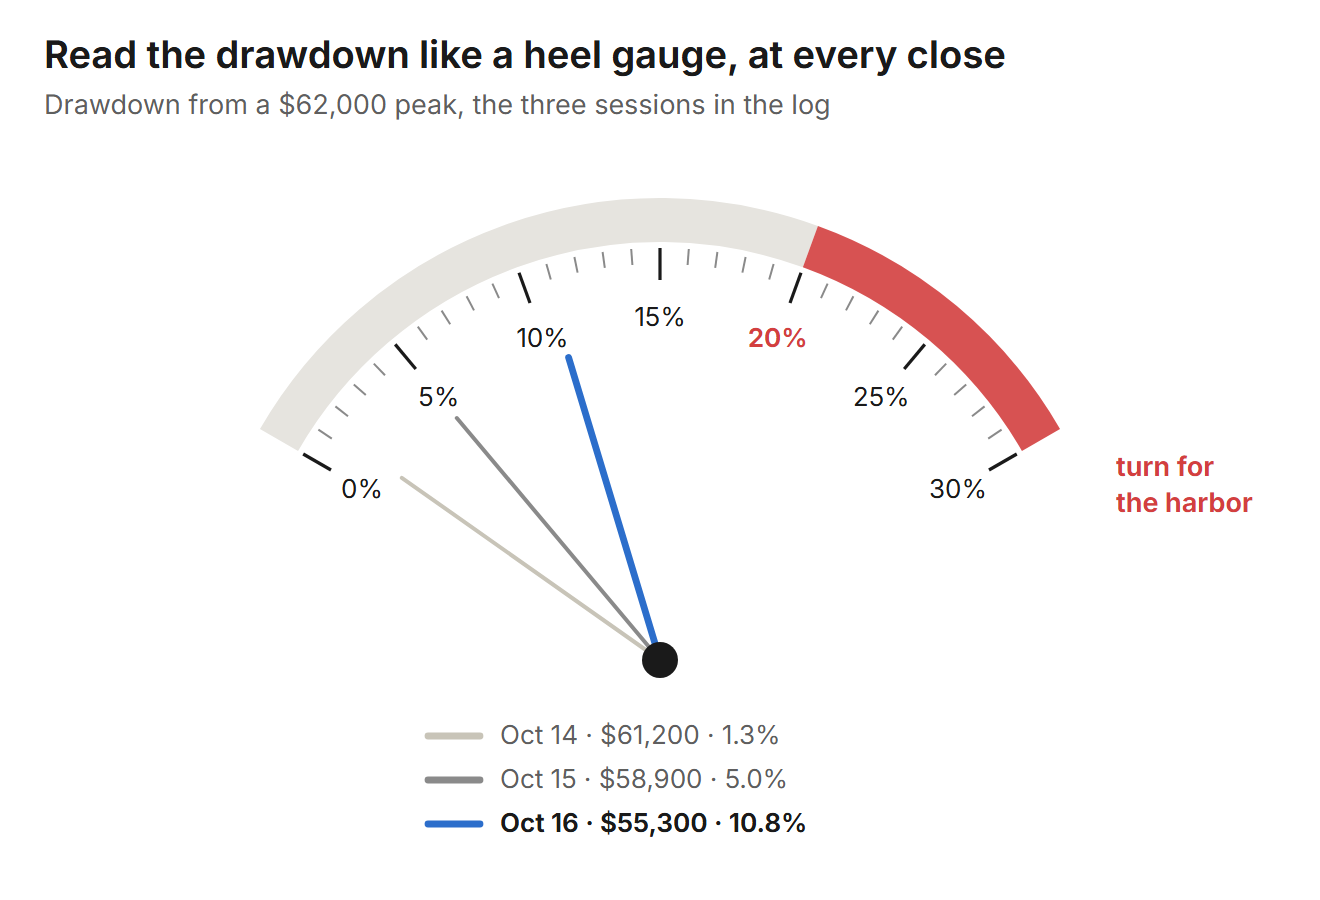
The log above, read as an instrument
The line is checked at the close, and the market does not wait for it. The Cerebras account that kept borrowing into the rally peaked at $229,000 on the August 12 close. The next morning's open took it to $155,000, 32% below its peak in a single print. It crossed a 20% line overnight, with no close in between to stop at. Size so that the largest overnight gap your stocks have made in the past year, at your position size, still leaves you short of the line.
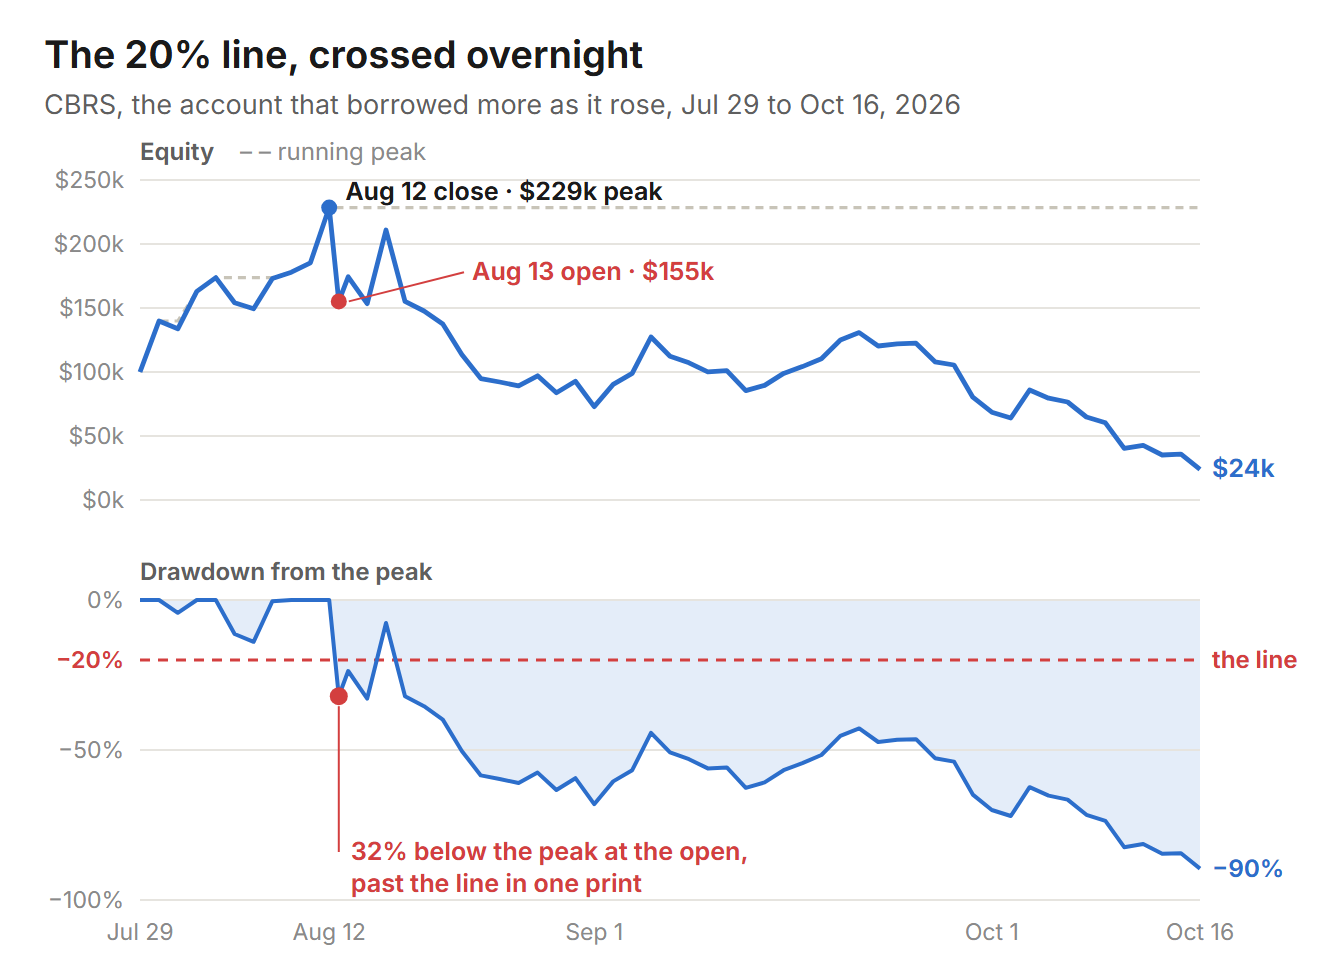
CBRS daily prices, Jul 29 to Oct 16, 2026 · the replay from Leverage Works Both Ways
Write the 20% down before the first trade. A limit chosen in the middle of a drawdown moves.
There is a fair objection. A system can hit its limit, sit idle while you review it, and then recover without you. That happens, and the trader on the sidelines misses the recovery. The trader who kept going at full size through a broken system misses nothing, until the account is too small to trade. A stop at 20% leaves 80% of the account to come back with. The climb from 20% down is 25%. From 50% down it is 100%.
Read the water before you go out the Gate#
San Francisco Bay is protected water. Inside it, a small boat can sail all afternoon in a stiff breeze with a harbor never far away. Outside the Golden Gate Bridge is the Pacific.
A Bay sailor heading out knows three things before leaving the dock: the tide times, the current and the wind. The whole bay fills and empties through the Gate. On an ordinary day the flood pours in through it at more than three knots and the ebb pours out at four and a half, faster on the big tides. A small cruising boat under sail makes five or six knots through the water. Going out the Gate at maximum flood means crawling past the rocks at walking pace, burning the afternoon to cover a mile.
Coming home at maximum ebb is worse. The current runs out of the bay while the afternoon westerly blows in at twenty-five knots. Wind against current stands the water up into short, steep waves by the south tower. Boats get knocked down there.
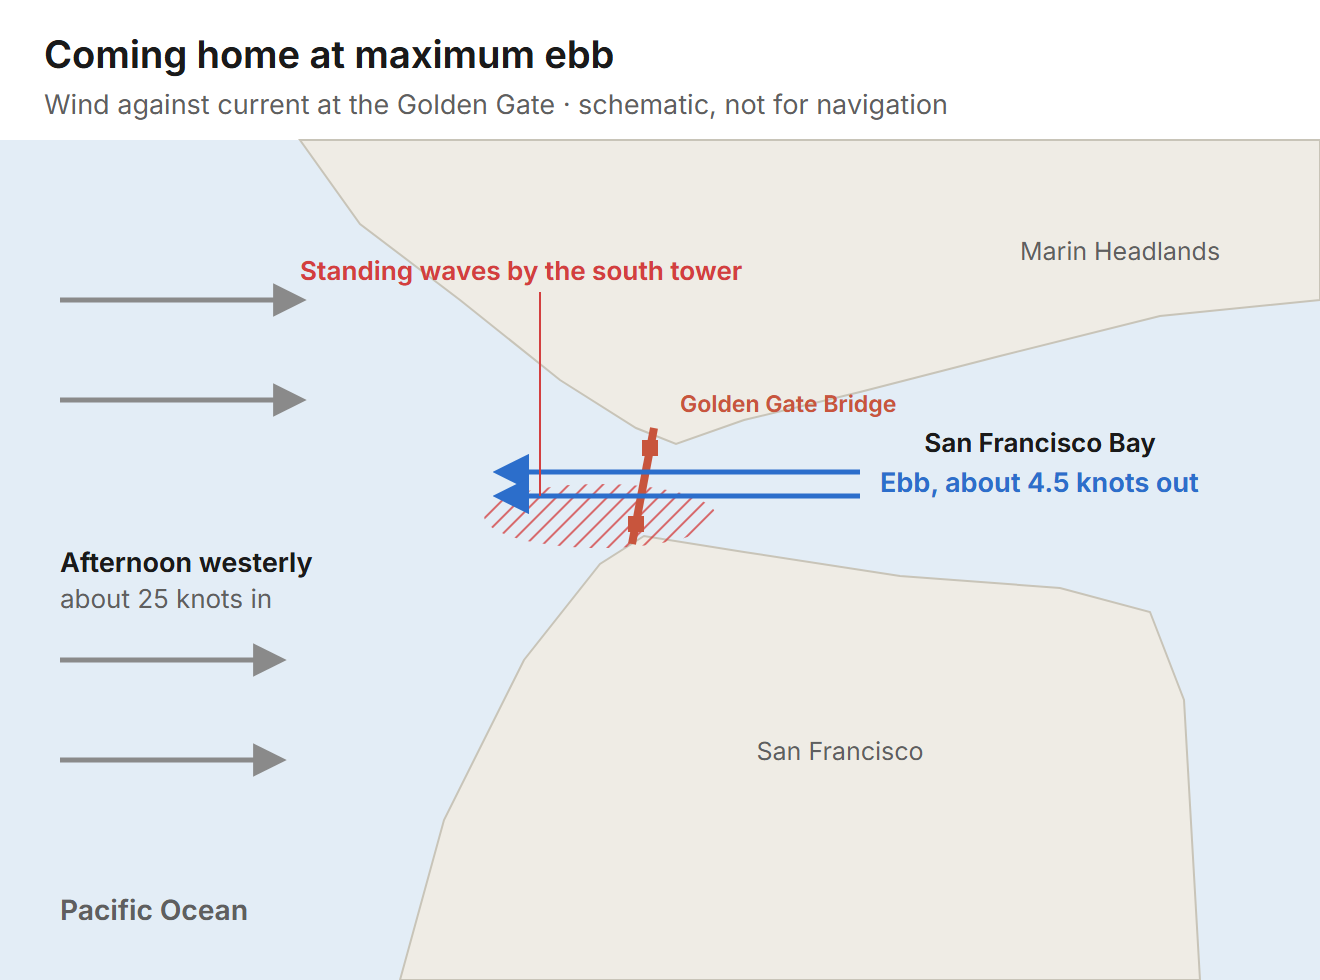
Schematic, not for navigation
None of this is hidden. The tide and current tables are published a year ahead. The sailors who get into trouble at the Gate are the ones who did not look.
A trader has the same three readings before every session:
- The tide table is the calendar. Earnings reports, Fed announcements, CPI and the jobs report are scheduled weeks ahead, to the minute.
- The current is the market's direction. Trending, chopping in a range, or turning.
- The wind is the size of the moves. How far prices travel in a day, and how suddenly they gust.
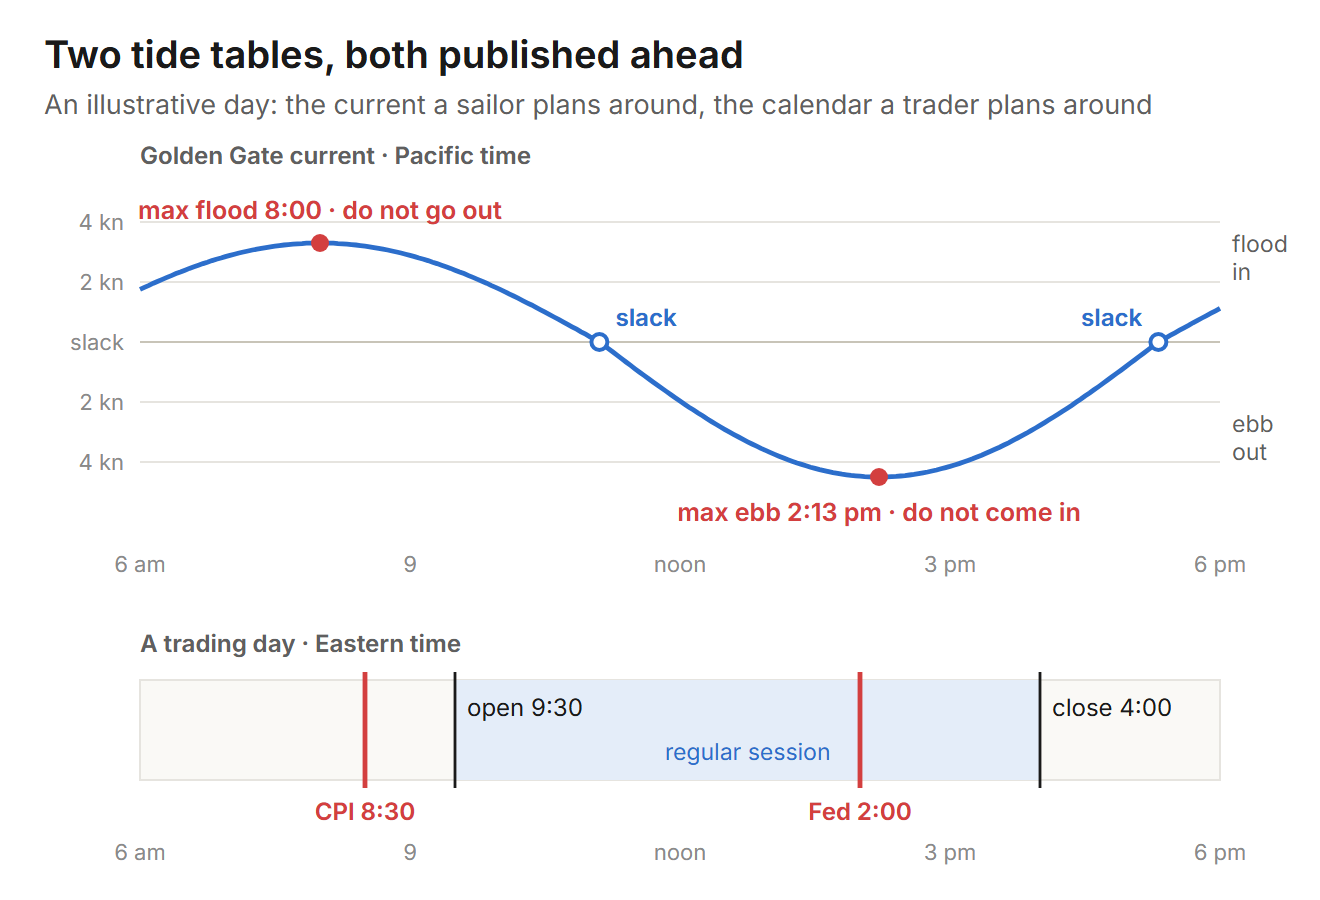
An illustrative day · both schedules are published in advance
Holding a full-size position into an announcement your system was never tested through is going out the Gate at maximum flood. Pressing a system built for trending days into a market that has chopped for three weeks is coming home on the ebb. Check all three before the open. If the water is wrong, stay inside the bay.
Before the next session#
- Ballast. The account holds money you will not need for at least a year. Living expenses sit elsewhere.
- Sail. Risk per trade is set from the table, 1% or less, and your setups fit inside it at this account size.
- The line. The maximum drawdown is written down, 20% from the peak, and your largest likely overnight gap does not reach it.
- The log. Closing balance, peak and drawdown are recorded after every session.
- The water. Calendar, market direction and size of the moves checked before the open.
A boat that gets all five right still meets the gust. It comes back upright.
Ballast first, then sail.
On the numbers. The streak probabilities are exact for 200 independent trades at a fixed win rate, computed by dynamic programming over the length of the current losing run. The drawdown table compounds a fixed percentage risk on a shrinking balance: after n straight losses at risk r, the drawdown is 1 − (1 − r)ⁿ. The Cerebras figures are the account that borrowed more as it rose, from the replay in Leverage Works Both Ways. The chart here rebuilds that account on CBRS daily prices, which reproduces the $229,000 peak, the $155,000 open and the $24,000 finish; its five forced sales land within about 1% of the one-minute replay's prices. The current chart is an illustrative day built from typical maximum speeds at the Gate, about 3.3 knots of flood and 4.5 of ebb. Golden Gate current speeds vary by day. Plan a passage on that day's NOAA current predictions for the Golden Gate.