Bottom line
Net of friction with a 2% cash credit, the system returns 3.6% CAGR over 2005–2026 (total +112%) against the S&P 500’s 10.8% (total +806%) — it trails the index on raw return, at ~42% average exposure and roughly half the worst-case drawdown (−22.8% vs ~−55%). A random-selection book on the same universe and exits returns about 0% net; the strategy holds profit factor 1.07 over the full window and 1.10 out-of-sample. No parameters were fit. Every figure sits next to a random baseline and a buy-and-hold benchmark; no grade is assigned. Terms (CAGR, profit factor, drawdown, survivorship-bias-free) are defined in the glossary.
1. How it works
| Element | Rule |
|---|---|
| Universe | S&P 500 Dividend Aristocrats, point-in-time membership including names later dropped (146 ever-members; ~50–70 live at any time) |
| Liquidity filter | 25-day average volume > 100,000 |
| Entry signal | 2-period RSI below 10 on the latest close |
| Ranking | 100-day annualized realized volatility, highest first |
| Entry | next session at the open (market) |
| Position size | round( 0.30 × equity × 0.0075 / ATR(14) ) shares — ATR risk-parity |
| Exit | first close above the prior day’s high, or six calendar days held — whichever first |
| Stop | none (open risk bounded by the time exit) |
| Slots | up to 10 concurrent positions |
2. Universe and data
Membership is resolved as of each trigger date from a point-in-time record that includes companies later removed from the index, so a name that was an Aristocrat in 2009 and later dropped is present in the 2009 universe and absent afterward. This removes the survivorship bias a current-membership list would introduce — a first-order effect for this index, whose membership changes whenever a company fails to raise its dividend. Prices are total-return adjusted (dividends reinvested) and consistent across all 145 covered names; one recent ticker change lacks history and is excluded. The raw price data is licensed and is not redistributed; the committed artifacts are derived results.
3. Versus buy-and-hold
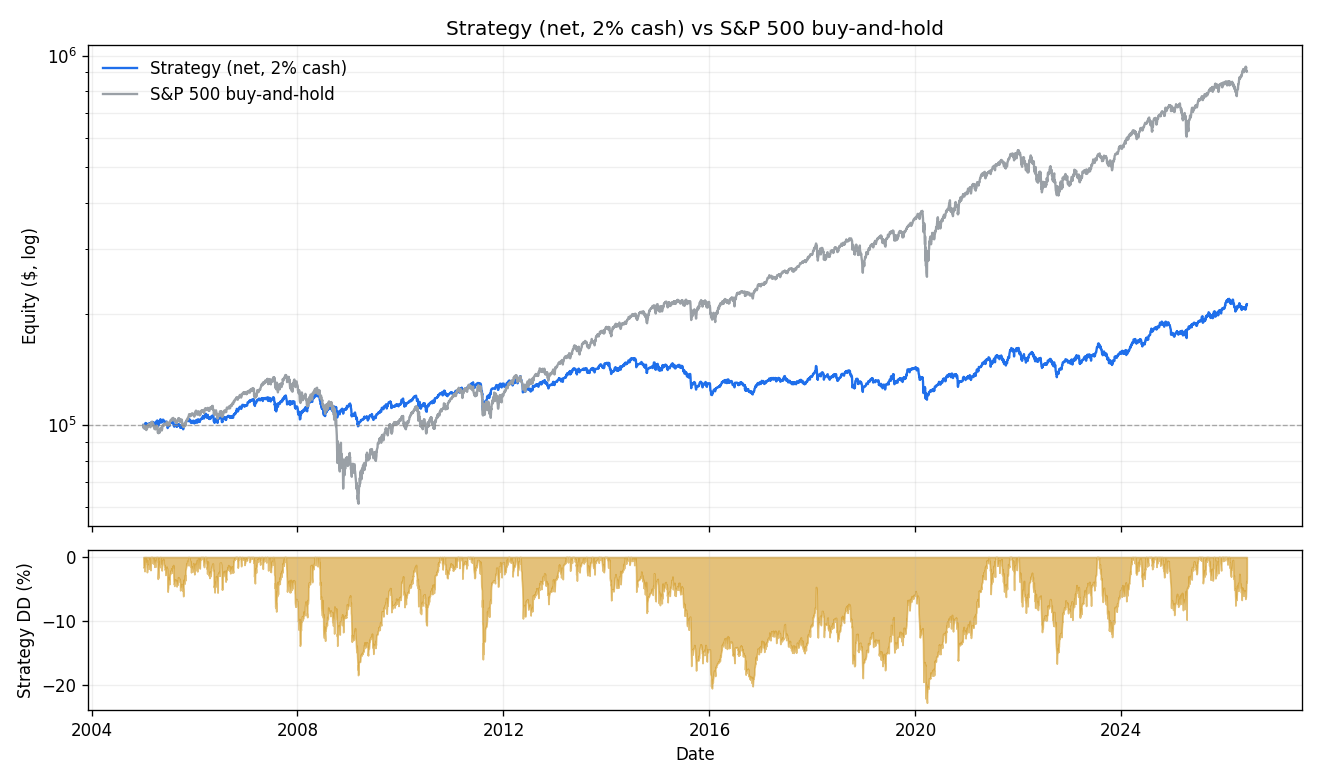
The honest comparison for any long book is the index it draws from. Over 2005–2026 the system underperforms the S&P 500 on total return by a wide margin, at a fraction of the exposure and roughly half the worst-case drawdown.
| Book | Total return | CAGR | Max drawdown | Avg exposure |
|---|---|---|---|---|
| HV-RSI Aristocrats (net, 2% cash) | +112% | 3.58% | −22.8% | ~42% |
| HV-RSI Aristocrats (gross, no cost) | — | 7.99% | −17.3% | ~42% |
| S&P 500 buy-and-hold (total return) | +806% | 10.83% | ~−55% (2008–09) | 100% |
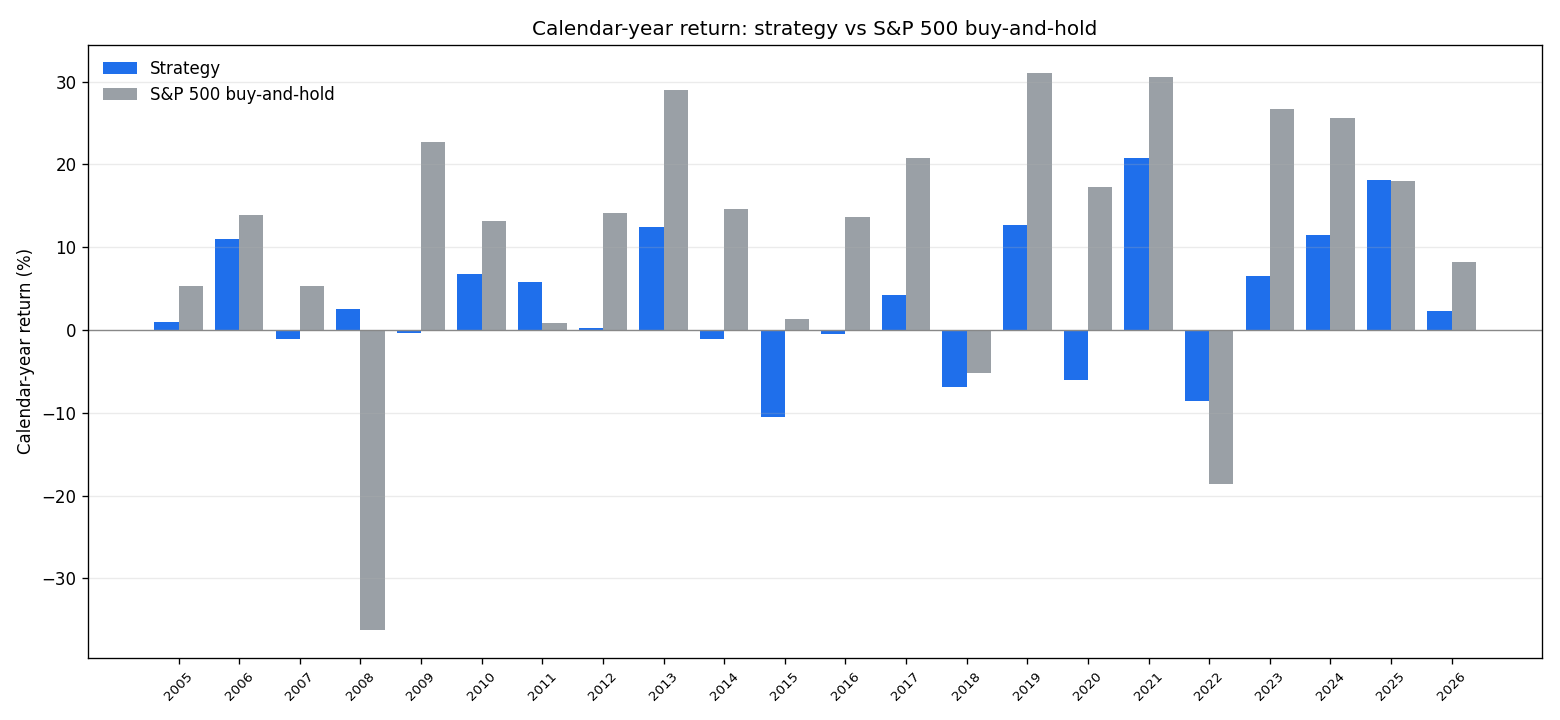
4. Calendar-year returns
Strategy return and worst intra-year drawdown each year, against the buy-and-hold benchmark. The system’s defensive years (2008, 2022) and its lag in strong-trend years (2013, 2019, 2021) are both visible.
Year-by-year table
| Year | Strategy % | Intra-year max DD % | Buy-and-hold % |
|---|---|---|---|
| 2005 | 0.93 | −6.1 | 5.32 |
| 2006 | 11.05 | −5.55 | 13.84 |
| 2007 | −1.05 | −8.5 | 5.33 |
| 2008 | 2.54 | −13.85 | −36.24 |
| 2009 | −0.39 | −13.26 | 22.66 |
| 2010 | 6.73 | −9.56 | 13.14 |
| 2011 | 5.75 | −15.96 | 0.85 |
| 2012 | 0.19 | −9.59 | 14.17 |
| 2013 | 12.44 | −3.68 | 29.00 |
| 2014 | −1.14 | −8.71 | 14.56 |
| 2015 | −10.53 | −15.14 | 1.29 |
| 2016 | −0.43 | −8.93 | 13.59 |
| 2017 | 4.18 | −5.07 | 20.78 |
| 2018 | −6.89 | −14.94 | −5.25 |
| 2019 | 12.73 | −6.72 | 31.09 |
| 2020 | −6.05 | −18.43 | 17.24 |
| 2021 | 20.82 | −6.23 | 30.51 |
| 2022 | −8.56 | −16.65 | −18.65 |
| 2023 | 6.49 | −12.49 | 26.71 |
| 2024 | 11.45 | −7.92 | 25.59 |
| 2025 | 18.13 | −4.74 | 18.01 |
| 2026 (partial) | 2.35 | −7.57 | 8.18 |
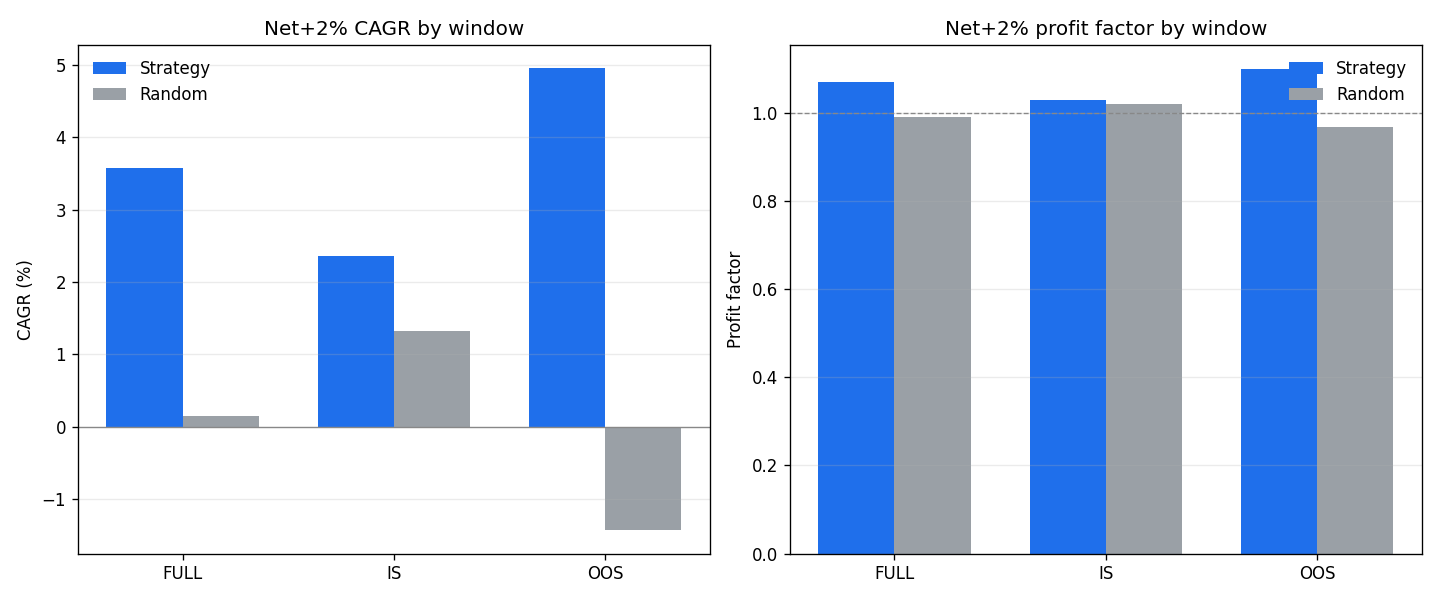
5. Portfolio detail — strategy vs random selection
Frictions (5 bps per side plus a per-share commission) are applied to the strategy and to the random baseline alike. Idle cash is credited at an explicit 0% (gross) / 2% / 4% annual rate. Twenty random-selection seeds are averaged. No parameters were fit; the windows are a robustness split.
| Window | Book | Trades | Win rate | Profit factor | CAGR | Max DD | Return/DD |
|---|---|---|---|---|---|---|---|
| Full 2005–26 | strategy, gross (0%) | 7,976 | 62.6% | 1.22 | 7.99% | −17.3% | 0.46 |
| Full 2005–26 | strategy, net + 2% cash | 7,973 | 60.9% | 1.07 | 3.58% | −22.8% | 0.16 |
| Full 2005–26 | strategy, net + 4% cash | 7,976 | 60.8% | 1.07 | 4.70% | −19.3% | 0.24 |
| Full 2005–26 | random selection, net + 2% | 9,878 | 59.6% | 0.99 | 0.14% | −38.5% | 0.01 |
| 2005–2017 | strategy, net + 2% cash | 4,453 | 60.3% | 1.03 | 2.35% | −20.5% | 0.11 |
| 2005–2017 | random selection, net + 2% | 5,936 | 59.5% | 1.02 | 1.32% | −37.1% | 0.04 |
| 2018–2026 | strategy, net + 2% cash | 3,517 | 61.4% | 1.10 | 4.96% | −20.6% | 0.24 |
| 2018–2026 | random selection, net + 2% | 4,822 | 59.6% | 0.97 | −1.43% | −30.6% | −0.03 |
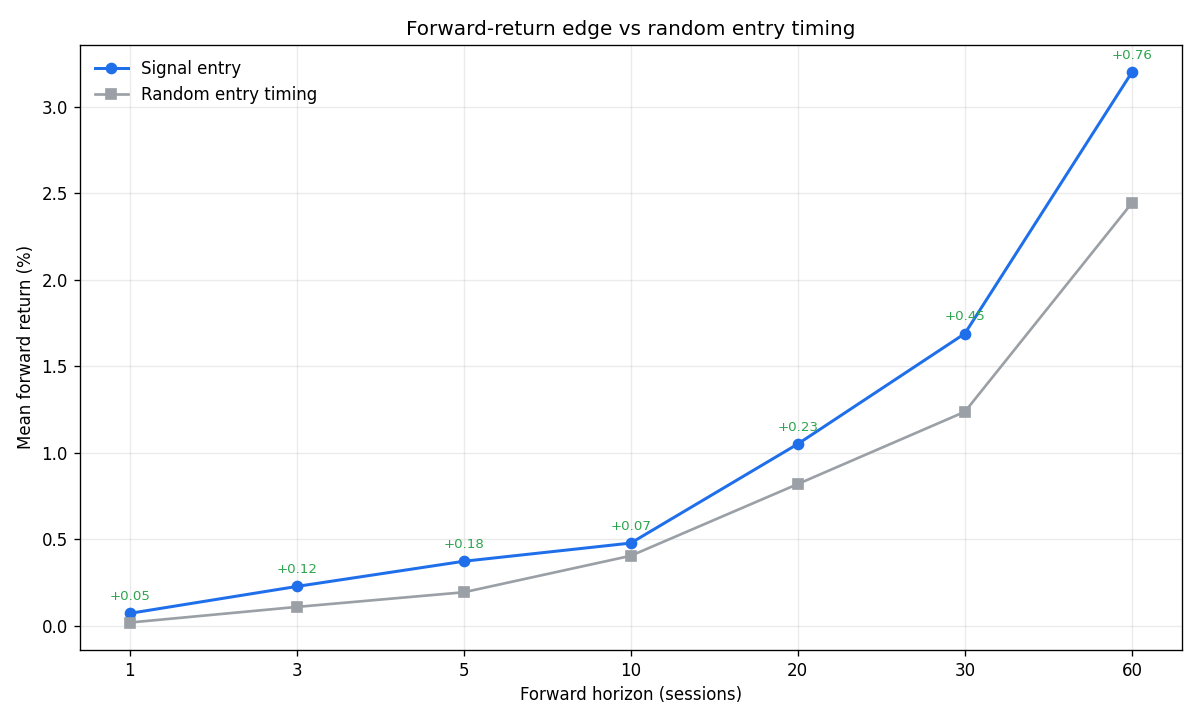
6. Entry timing — event quality
Separately from the portfolio, each oversold entry (34,301 events) is measured against a random entry day on the same names. Entering on an RSI-below-10 day beats a random entry day at every horizon measured, by a small margin that grows with horizon:
| Horizon (sessions) | Signal fwd return | Random-timing fwd return | Edge |
|---|---|---|---|
| 1 | 0.071% | 0.018% | +0.053% |
| 5 | 0.372% | 0.193% | +0.179% |
| 10 | 0.477% | 0.404% | +0.073% |
| 20 | 1.050% | 0.818% | +0.232% |
| 60 | 3.198% | 2.442% | +0.756% |
Within ten sessions the signal names reach +3 ATR 18.2% of the time and −3 ATR 16.3% of the time, versus 16.1% / 15.0% for random entry days — the favorable-to-adverse balance is close to symmetric and marginally favorable.
7. What is not yet tested
- A live walk-forward — the out-of-sample window is a historical split, not a forward record.
- Sensitivity to the RSI threshold, hold length, and slot count (none were varied; all come from the supplied ruleset).
- A protective stop — the ruleset uses none; its absence sets the open-risk profile and is not separately stress-tested here.
- Use as a sleeve inside a larger, fuller-exposure book — the natural reading of a ~42%-invested low-drawdown system — is not modeled.
- An ablation of sizing (ATR vs equal-weight) and the exit rule, and a Sharpe / rolling-Calmar view, are planned next steps.
- Tax treatment of the dividend stream is not modeled (long only; no borrow).
8. Reproducibility
The headline figures recompute from the committed daily equity curve with the pure-standard-library check in
code/repro_check.py (data/equity_curve.csv → data/repro_headline.csv),
which verifies page-vs-artifact consistency. The backtest is not re-run from raw price bars, which are licensed
and not redistributed (the committed data/ artifacts are the frozen results). The engine and
analysis code are included for inspection under code/.