Executive summary
This is a part-time book. It buys a Dividend Aristocrat only after a sharp two-day sell-off (a 2-period RSI under 10), favours the most volatile of the candidates, sizes each by ATR, holds up to ten at once, and exits into the first close above the prior day’s high or after about a week. On an average day it has roughly 42% of the book at work and the rest in cash.
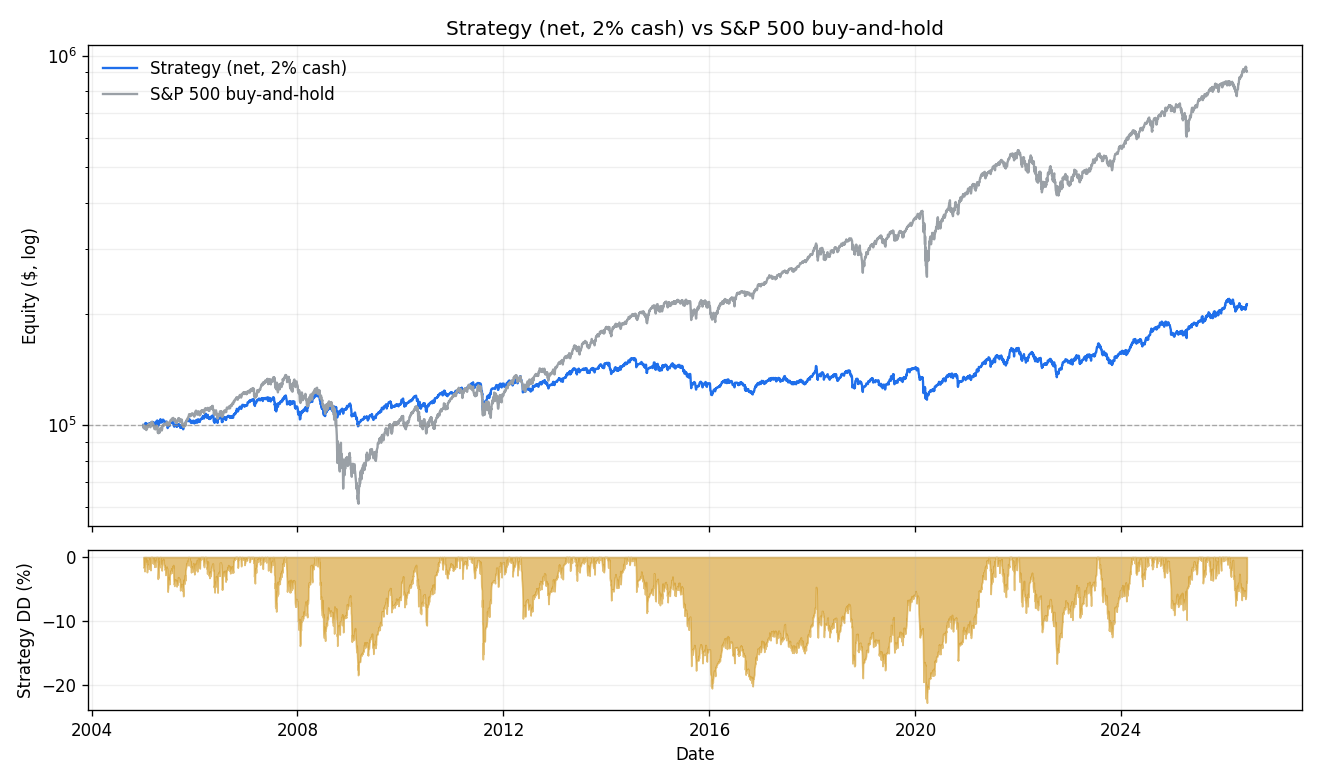
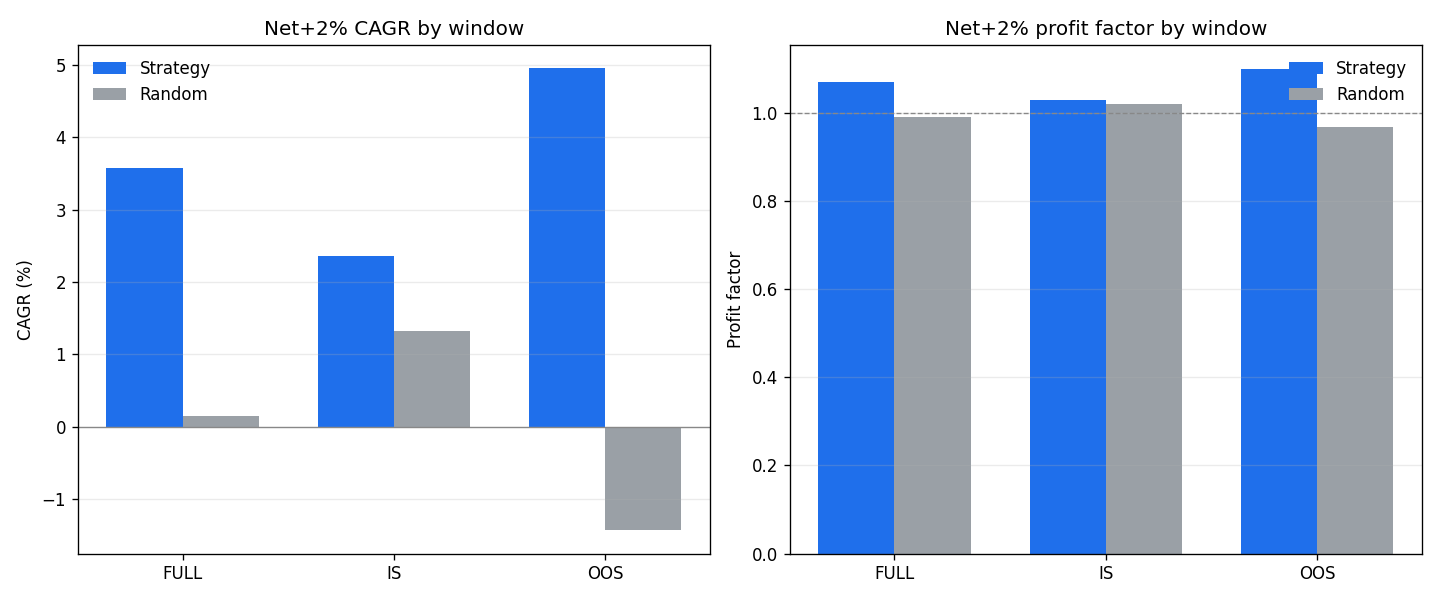
Because it is rarely fully invested and trades a thin per-trade edge, its headline return is modest. Net of costs it compounds at about 3.6% a year over 2005–2026; the S&P 500, fully invested, returned about 10.8%. On raw return it trails the index, plainly. What it offers instead is a shallower ride and a selection rule that carries real information: keep every rule the same but pick the names at random, and the book goes flat-to-negative net of costs — the real selection stays profitable, and the gap widens out-of-sample.
Reading a part-time book against a full-time index
On drawdown the difference is real: a worst loss of about −22.8% net over 21 years, against roughly −55% for the S&P 500 in 2008–09. The book gained 2.5% in 2008 while the index fell 36%, and fell 8.6% in 2022 against the index’s 18.7% decline. It also lagged badly in strong-trend years (2013, 2019, 2021) — the same caution that limits the downside caps the upside. It does not out-compound the index, and is not presented as doing so.
Skill or luck? the random-selection test
The selection’s measured effect is to roughly double the per-trade return and roughly halve the drawdown, rather than to lift the win rate, which is within about a point of random either way. The edge is real but modest, and it is clearest in the later, out-of-sample years — where the random book turns slightly negative net and the strategy does not.
How it works, in plain terms
- A quality universe. Only S&P 500 Dividend Aristocrats — companies with 25+ years of consecutive dividend increases, a screen for financial durability.
- Only deep selling. A name qualifies when its 2-period RSI drops below 10 — a sharp, short-term sell-off. Among those, the most volatile are taken first.
- Quick exit. Sell into the first close above the prior day’s high, or after six calendar days — then back to cash. No protective stop; the open risk is bounded by the time exit.
Tested the hard way
Real history, including the losers. Membership is point-in-time and includes companies later dropped from the index when they failed to raise their dividend — so the result is not flattered by trading only today’s survivors. That matters for this index in particular, whose roster turns over precisely on dividend cuts.
Dividends are in the prices. All figures are on total-return data (dividends reinvested), consistent across the 145 covered names — essential for a dividend-focused universe, where leaving payouts out would both understate return and distort the oversold signal on ex-dividend days.
Costs and cash, stated plainly. Friction is 5 bps slippage per side plus a per-share commission, applied to the strategy and the random book alike; on a ~0.30% gross per-trade edge that roughly halves the per-trade return. Because the book sits ~58% in cash, the headline credits an explicit 2% on the idle balance — the Deep Dive also shows the 0% and 4% lines, since your own cash rate moves the number.
It holds up on unseen data. No parameters were fit, so splitting the history in two is a clean robustness check: the edge over the random book is intact in the later half (profit factor 1.10 vs 0.97). A live walk-forward is the natural next test.
View the full year-by-year and entry-timing detail
The calendar-year return and intra-year drawdown table, the full strategy-vs-random portfolio breakdown, and the entry-timing event study (oversold entries vs random entry days, across seven horizons) all live on the Deep Dive.
Who this is for
This fits a portfolio manager looking for a defensive, dividend-quality sleeve — a book valued for a shallower drawdown and a selection edge that survives costs, run on a fraction of the capital with the rest in cash earning yield or funding other strategies. It is a complement, prized for the shape of its returns rather than their size. As a standalone engine meant to beat the index, it is not that, and is not presented as that.
Let’s stress-test this for your mandate
No off-the-shelf backtest matches a real risk tolerance, capital constraint, or regulatory mandate. This study is a baseline demonstration of our research process. If you manage institutional capital, a family-office allocation, or a private portfolio, we can adapt the engine to your exact parameters.
Request a bespoke portfolio study
- Your universe: your watchlist, a sector sleeve, or a different index.
- Real-world execution: your fee schedule, realistic fills, and a cash-yield sleeve on the large idle balance.
- Custom overlays: a protective stop, volatility targeting, or pairing with a full-exposure book.
Or audit it yourself
Want the Python, the daily trade logs, and the data behind every number here? Get the full package — we email a personal download link.
For a bespoke study on your own universe, start a conversation — typically delivered within a few business days.
→ Full Deep Dive with the complete methodology, the random baselines, the calendar-year record, the entry-timing study, and the reproducibility check.