SSC Scan
ProductionFind symbols in a Supported Spring Crossing pattern — bullish reversal signal.
Bullish trend reversal scanning
The Supported Spring Crossing (SSC) is a bullish trend reversal pattern — support holds, price springs, and a short-term average crosses a longer-term average from below. The SSC Scan runs this pattern daily across every US equity and returns a clean candidate list. Pair with PFL for entry timing and the Main template for context.
Supported Spring Crossing (SSC)
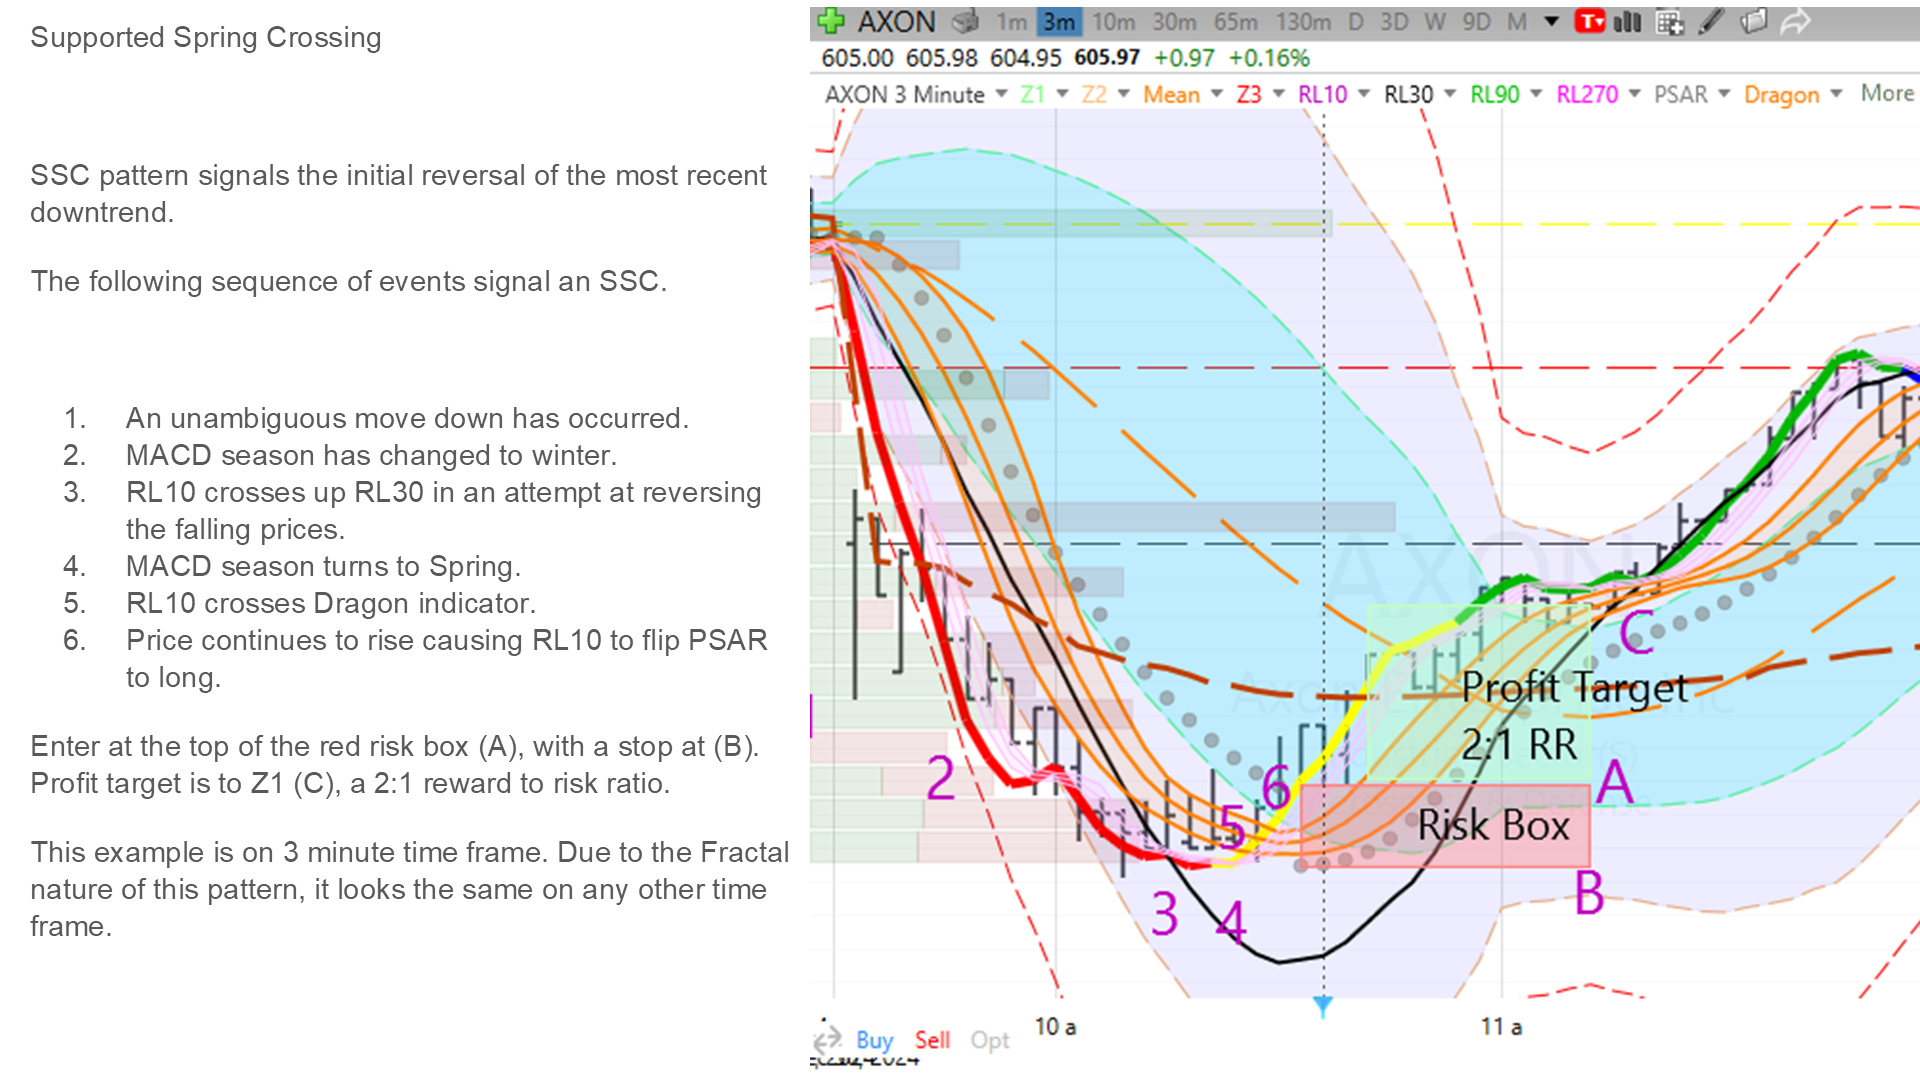
SSC is the initial reversal of the most recent downtrend. The pattern forms when price, momentum, and trend all rotate together — giving a low-risk long entry at the bottom.
- An unambiguous move down has occurred.
- MACD season has changed to winter.
- RL10 crosses up RL30 in an attempt at reversing the falling prices.
- MACD season turns to spring.
- RL10 crosses Dragon indicator.
- Price continues to rise, causing RL10 to flip PSAR to long.
This example uses a 3-minute timeframe. Due to the fractal nature of the pattern, the same sequence appears on every timeframe — 1m, 5m, 15m, 1h, daily, weekly.
Supported Spring Crossing (SSC)
SSC is the initial reversal of the most recent downtrend. The pattern forms when price, momentum, and trend all rotate together — giving a low-risk long entry at the bottom.
- An unambiguous move down has occurred.
- MACD season has changed to winter.
- RL10 crosses up RL30 in an attempt at reversing the falling prices.
- MACD season turns to spring.
- RL10 crosses Dragon indicator.
- Price continues to rise, causing RL10 to flip PSAR to long.
This example uses a 3-minute timeframe. Due to the fractal nature of the pattern, the same sequence appears on every timeframe — 1m, 5m, 15m, 1h, daily, weekly.
Supported Spring Crossing Scan| LifelongEdge
Supported Spring Crossing Scan
Supported Spring Crossing Pattern Scan
This scan will find symbols that are in an SSC pattern formation on the time frame selected in the time frame link.