SlopeZs
ProductionSlopes for RL10, RL30, SMA10, SMA30 with z-scores. Available in dark and light themes.
SlopeZs
Slopes for RL10, RL30, SMA10, SMA30 with their z-scores. Includes RL10 and RL30 mean-crossing indicators.
- RL10 Slope and its z-score (color coded by z-value).
- SMA10 Slope and its z-score.
- RL10XM: spike when RL10 crosses SMA30 (yellow up, orange down).
- RL30XM: spike when RL30 crosses SMA30 (dark yellow up, dark orange down).
- RL30 Slope and SMA30 Slope with their z-scores.
With TC2000 flexibility, combine multiple indicators to suit your preference. Slope + z-score + mean crossing gives compact, information-dense views.
SlopeZ Layouts | LifelongEdge
Slope Zs
Targeting Essentials
TargetingEssentials
Slope Z Layout
Calculates the Slope in a Z-Score format of the following indicators, displayed as column indicators shown below or as chart indicators shown above.
-
RL10 Slope
-
RL10 Slope-Z
-
RL30 Slope
-
RL30 Slope-Z
-
SMA 10 Slope
-
SMA 10 Slope-Z
-
SMA 30 Slope
-
SMA 30 Slope-Z
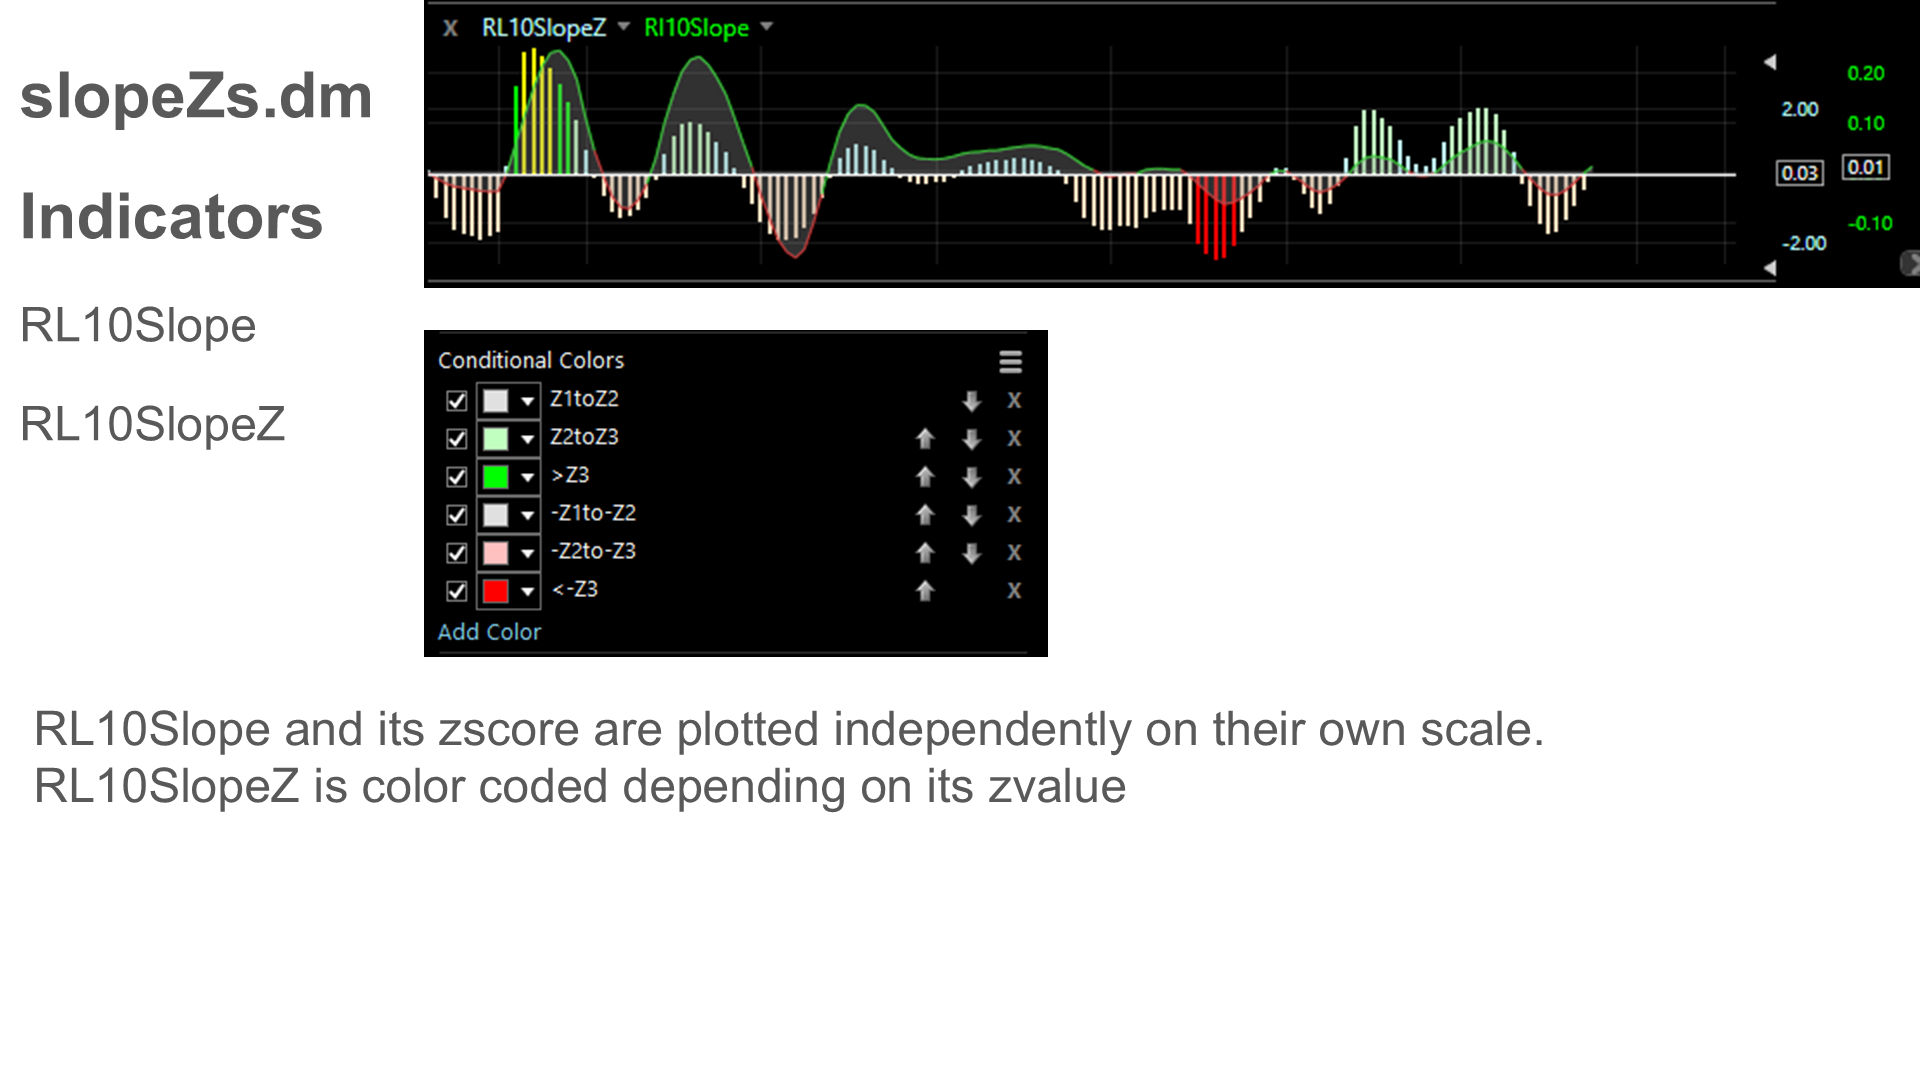
Let's review the RL10 indicator.
We plot the RL10 Slope value as a line and the RL10 Slope Z-Score value as a histogram. They are plotted independently on their own scale.
The histogram is color coded according to their Z-Scores as described in the conditional color table.
We have also overlaid a third signal, which is the RL10 crossing the Mean. This is abbreviated as RL10XM. Just for clarity, the Mean is the thirty period simple moving average. RL10XM shows a positive (colored yellow) spike when RL10 crosses up through SMA30 (the mean) and a negative (colored orange) spike with RL10 crosses down through SMA30.
Note that we've packaged up the four indicator Z-Scores into one layout. In practice you'll use one or two of these indicators. Delete the ones you don't want.