SlopeStat.Scans
ProductionScans for SlopeStat turning points.
SlopeStat Scans
Scans for slope z-score turning points — when extreme readings reverse.
- Scan for when slope z-score < -3 and turns up (crosses above -3).
- Scan for when slope z-score > +3 and falls below +3.
- These extreme z-score reversals signal high-probability turning points.
Works on any timeframe — 3-minute for intraday, daily for swing trading.
Slopestat Layout | LifelongEdge
SlopeStat Layout
Slope Stat Layout
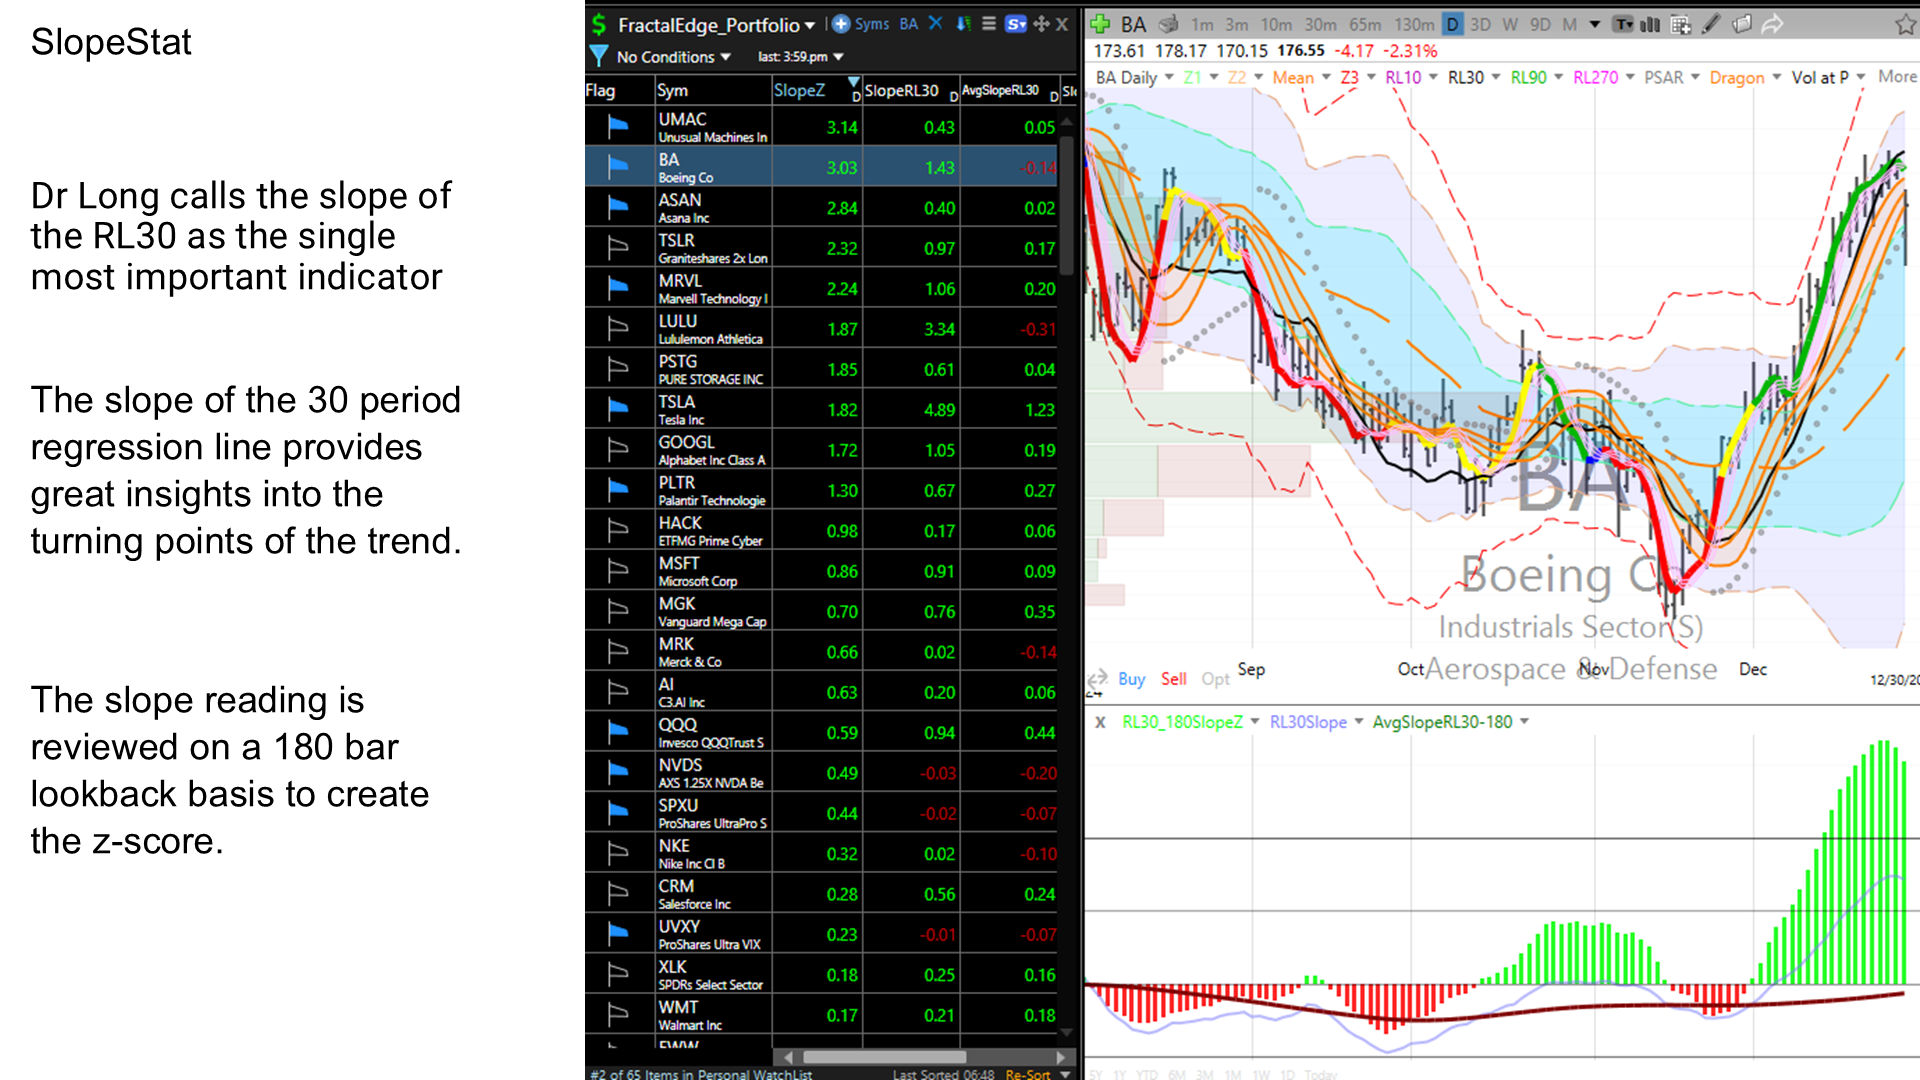
The slope of the 30 period regression line on a daily time frame provides great insights into the turning points of the trend. This score is reviewed on a 180 day lookback basis to create the z-score.
There are three layouts available
SlopeStat.LM - SlopeStat layout in light mode
SlopeStat.DM - SlopeStat layout in dark mode
SlopeStat.Scan - Scans for detecting when SlopeStat is signaling a turn in the slope
There are four columns above with the following calculations
-
Slope_RL30: The numerical value of the slope of the 30 period regression line. Slope_RL30: The numerical value of the slope of the 30 period regression line.
-
ZS_SlopeRL30_180: The Slope_RL30 over a 180 bar lookback converted into a z score. ZS_SlopeRL30_180: The Slope_RL30 over a 180 bar lookback converted into a z score.
-
Avg_SlopeRL30_180: The average value of the Slope_RL30 over a 180 bar lookback period. Avg_SlopeRL30_180: The average value of the Slope_RL30 over a 180 bar lookback period.
-
SD_SlopeRL30_180:The standard deviation of the Slope_RL30 over a 180 bar lookback period. SD_SlopeRL30_180:The standard deviation of the Slope_RL30 over a 180 bar lookback period.
For convenience, two columns connected to the Red Time Frame link are also provided.
The indicator on a chart is shown below.
ZS_SlopeRL30_180: Red Timeframe link, plotted as a histogram.
Colors are interpreted as:
Green: z score is positive, Red: z score is < 0
Yellow: z score turned up, Orange: z score turned down
Avg_SlopeRL30_180: is also plotted on the same chart as z score as it is useful to know if average is sloping up or down. Average is on its own scale, plotted to center on zero with the z score.
Slope_RL30: The actual slope value. The change in the slope mirrors its z score, just on a different scale. To avoid clutter we hide the plot by changing its opacity to zero. If you’d like to see the actual value you can make it visible.
You can also scan for when the Z-Score turns up or down as well as when it crosses from a particular level. We have the following pre-built scans with the corresponding screen shots below
-
Shows when the SlopeRL30 is turning down or turning up.
-
When the Z-Score is above Z3, implying an overbought issue, and when the Z-Score turns down and falls below Z3.
-
When the Z-Score is below -Z3, representing oversold issue, and when the Z-Score turns up and crosses above -Z3.
Note in the scan PZ3 means Plus Z3 and MZ3 means Minus Z3 and so on.