SlopeStat
ProductionSlope of 30-period regression line with 180-day lookback. Available in dark and light themes.
SlopeStat
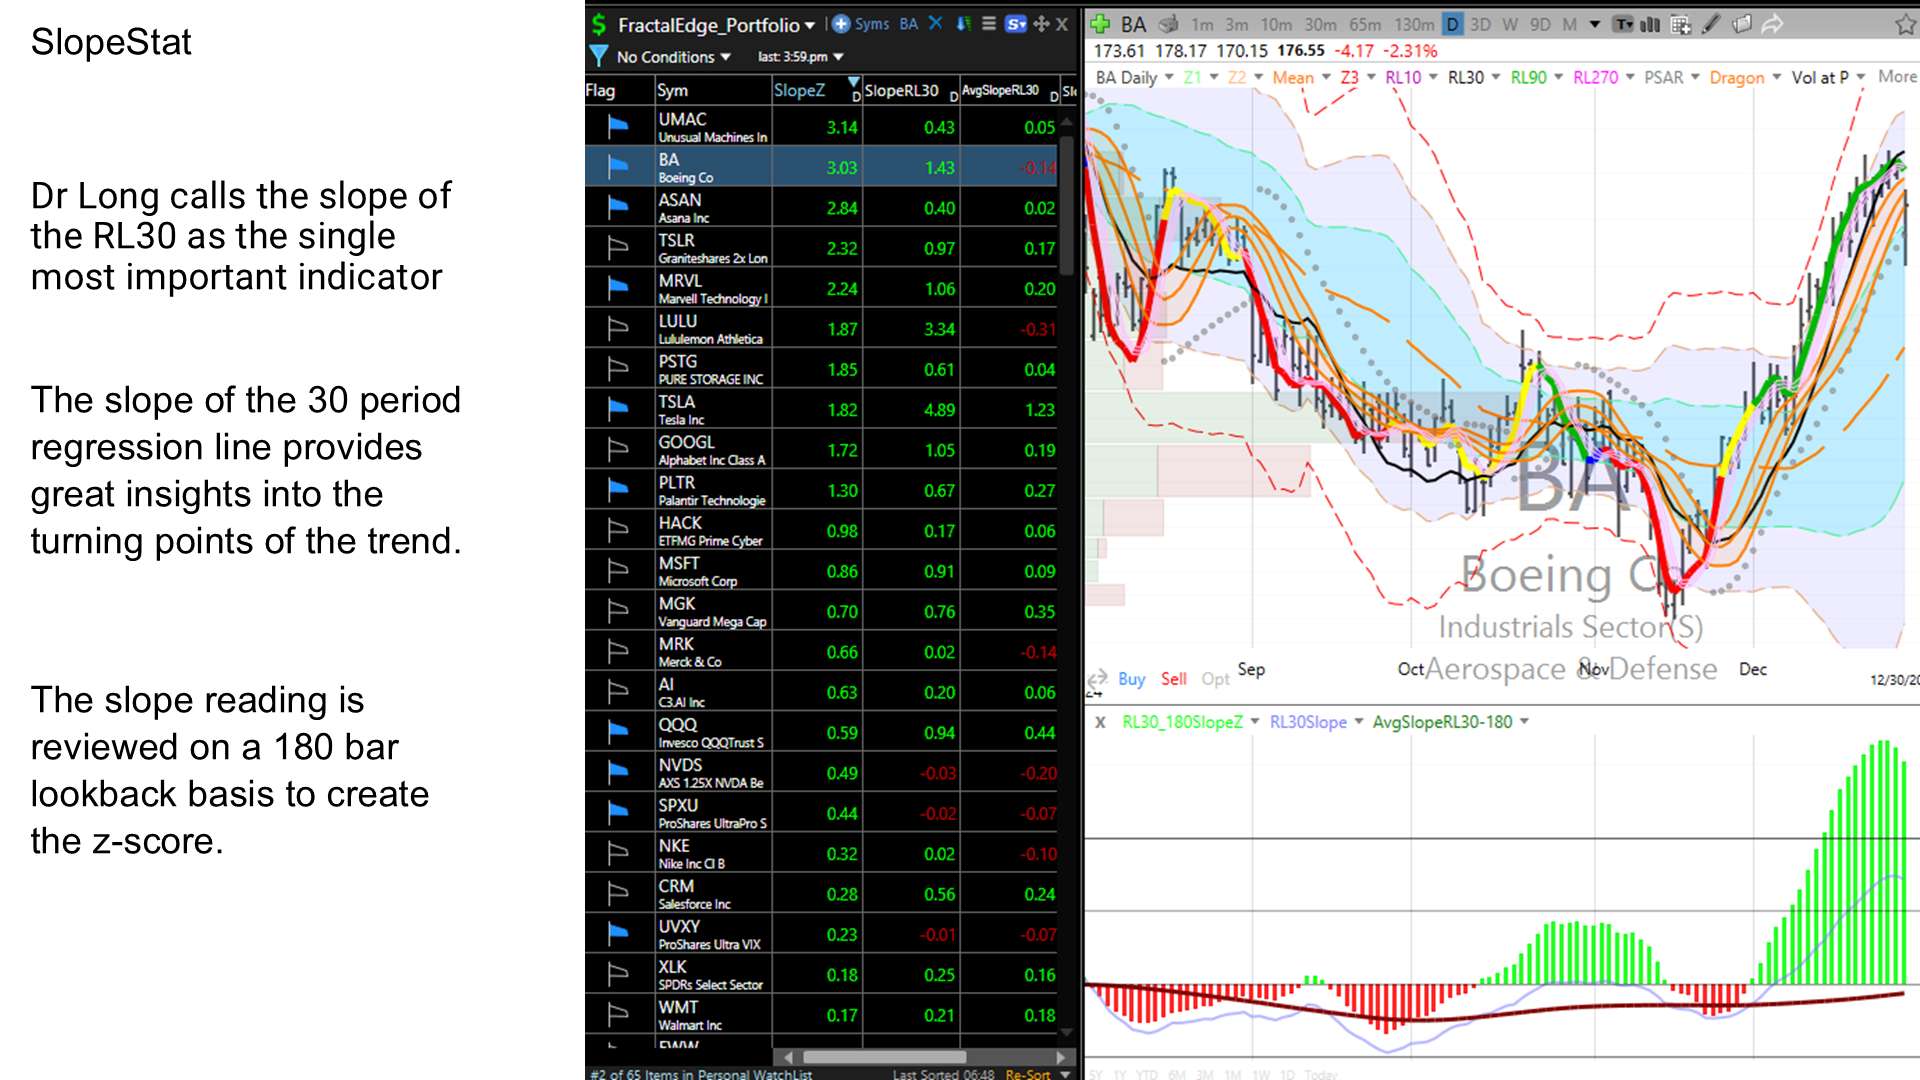
Dr. Long calls the slope of the RL30 the single most important indicator. The slope of the 30-period regression line provides insights into turning points. The z-score uses a 180-bar lookback.
- Slope_RL30 computed on the selected timeframe.
- Z-score of slope computed over 180-bar lookback.
- Histogram: green = positive z, red = negative z, yellow = turned up, orange = turned down.
- Average slope also plotted for trend context.
The z-score color coding (green/red/yellow/orange) gives at-a-glance trend direction and turning point signals.
SlopeStat
Dr. Long calls the slope of the RL30 the single most important indicator. The slope of the 30-period regression line provides insights into turning points. The z-score uses a 180-bar lookback.
- Slope_RL30 computed on the selected timeframe.
- Z-score of slope computed over 180-bar lookback.
- Histogram: green = positive z, red = negative z, yellow = turned up, orange = turned down.
- Average slope also plotted for trend context.
The z-score color coding (green/red/yellow/orange) gives at-a-glance trend direction and turning point signals.
SlopeZ Layouts | LifelongEdge
Slope Zs
Targeting Essentials
TargetingEssentials
Slope Z Layout
Calculates the Slope in a Z-Score format of the following indicators, displayed as column indicators shown below or as chart indicators shown above.
-
RL10 Slope
-
RL10 Slope-Z
-
RL30 Slope
-
RL30 Slope-Z
-
SMA 10 Slope
-
SMA 10 Slope-Z
-
SMA 30 Slope
-
SMA 30 Slope-Z
Let's review the RL10 indicator.
We plot the RL10 Slope value as a line and the RL10 Slope Z-Score value as a histogram. They are plotted independently on their own scale.
The histogram is color coded according to their Z-Scores as described in the conditional color table.
We have also overlaid a third signal, which is the RL10 crossing the Mean. This is abbreviated as RL10XM. Just for clarity, the Mean is the thirty period simple moving average. RL10XM shows a positive (colored yellow) spike when RL10 crosses up through SMA30 (the mean) and a negative (colored orange) spike with RL10 crosses down through SMA30.
Note that we've packaged up the four indicator Z-Scores into one layout. In practice you'll use one or two of these indicators. Delete the ones you don't want.