Mosaic
ProductionDr. Long's nine-box Market Type classification: trend, range, volatility, risk, gainers/laggards, and more.
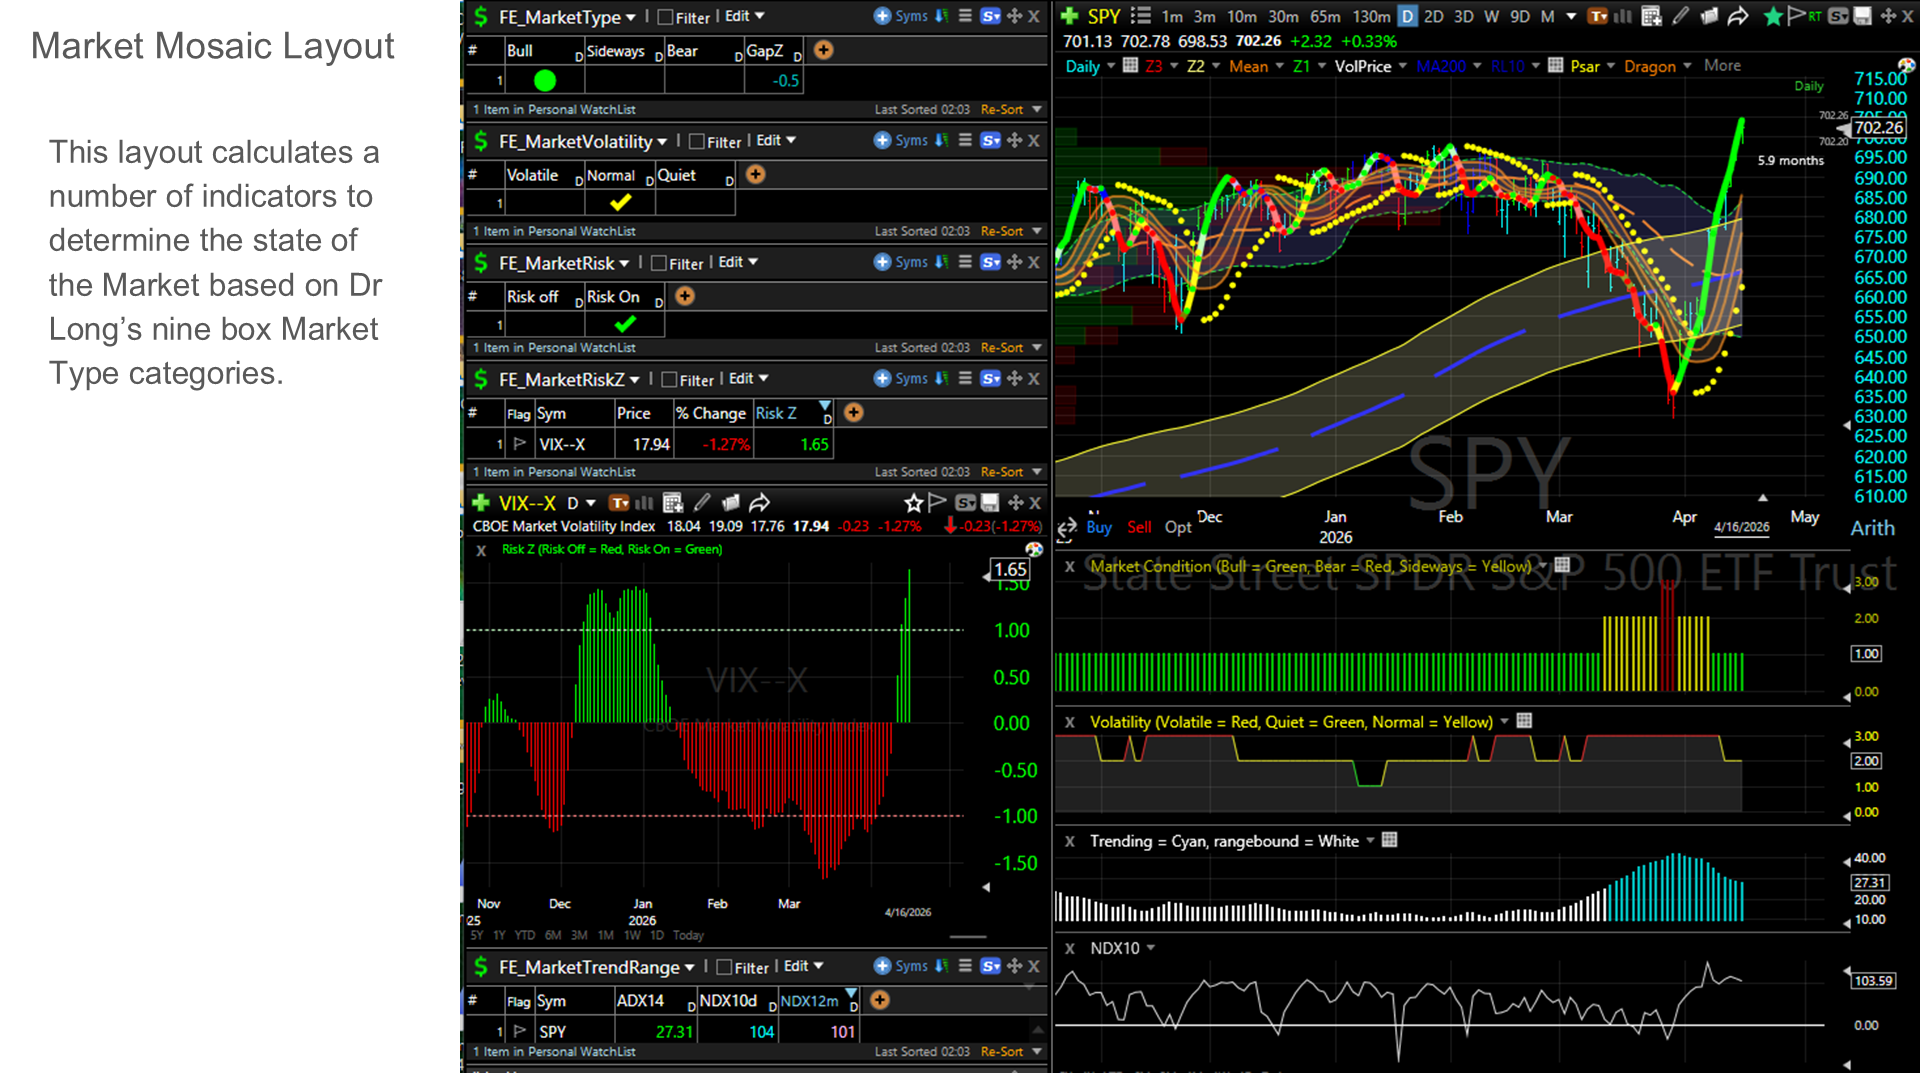
Market Mosaic
Calculates indicators to determine the state of the market based on Dr. Long’s nine-box Market Type categories.
- Market Type: bull, bear, or sideways based on price vs. 200-day MA (±2% thresholds).
- Market Trend: ADX14 determines trending (>25) vs. range-bound (<25).
- Market Range: NDX indicator over 10 days (short-term) and 12 months (long-term) OB/OS.
- Market Volatility: z-score of ATR% over 100 days — Volatile, Normal, or Quiet.
- Market Risk: ratio of 30-day to 10-day MA determines Risk On or Risk Off.
- Market Risk Z: z-score of the VIX for historical context.
Mosaic classifies market conditions so you can match your strategy to the regime. Risk Off suggests avoiding overnight positions.
Market Mosaic Layout | LifelongEdge
The Mosaic Layout
The Mosaic Layout is used to understand the current market environment. There are 13 concepts in this layout.
-
Market Type
-
Market Trend and Range
-
Market Volatility
-
Market Risk Env
-
Market Risk Z
-
Risk Z
-
Gainers (WL1)
-
Laggards (WL1)
-
Gainers (WL2)
-
Laggards (WL2)
-
Fundamentals
-
Next Earnings Date
-
Ex Dividend Rate
1. Market Type
Market type is a three box classification based on price and the 200 day MA. If price > 102% of the 200MA, market type is bull, if price is < 98% of 200MA, market type is bear, else it is sideways.
2. Market Trend and Range
ADX14 is used to determine if the market is trending. A value of 25 or greater implies a trending market while a value below implies a range bound market.
The NDX indicator (looks at the high / low range over a lookback) over the last 10 days established the short term overbought or oversold reading. The NDX over the last 12 months establishes the longer term OB/OS reading.
3. Market Volatility
The z-score of the ATR% over a lookback period (100 days) establishes the three-box market volatility. The market is either Volatile, Normal or Quiet.
4. Market Risk
The Risk on or Risk Off posture is determined by the ratio of the moving average of the longer term (i.e., 30 days) to the shorter term (10 days). Typically a Risk off suggests that holding overnight positions should be avoided.
5. Market Risk Z
The value of the z-score of the risk instrument, in this case the vix
6. Market Risk Z
The historical value of the Risk Z
7. Gainers (using DJ30 watchlist)
The components of the DJ30 sorted by 10 day change in descending order to create the list of gainers over the last 10 days.
8. Laggards (using DJ30 watchlist)
The components of the DJ30 sorted by 10 day change in ascending order to create the list of laggards over the last 10 days.
9. Gainers (Watchlist 2)
Similar to 7 but a separate watchlist
10. Laggards (Watchlist 2)
Similar to 9 but a separate watchlist.
11. Funamentals
Fundamentals of the selected symbol
12. Earnings Date
Next earnings date of symbols in the watchlist. Important for trading due to big moves that can take place post earnings release.
13. Dividend ExDate
Date at which a particular stock goes “ex-dividend”. Important as the price of the stock drops by the amount of dividend.