Main
ProductionCore template with RLs, Dragon, BB Means, Zs, PSARs. Available in dark and light themes.
Main Chart Template
The core template with 19 integrated indicators: regression lines, Dragon, Bollinger Band zones, PSAR, VWAP, and MACD Red River. Available in light and dark mode.
- RL10 with MACD season color coding — the proxy for price, color-coded by momentum season.
- RL30 — the proxy for trend health. RL10 crossing RL30 signals trend changes.
- RL90 and RL270 — interpret trends in higher timeframes.
- Bollinger Band Mean (Z0), Z1 (River), Z2 (FloodPlain), Z3 (extreme excursion).
- PSAR — signals turning points in the trend direction.
- Dragon — noise barrier between RL10 and PSAR. Watch RL10 crossing Dragon for entry/exit.
- Baby Dragon — first to signal reversal, susceptible to false signals. Use for profit preservation.
- VWAP and Volume at Price — market structure analysis.
- Previous day close, high, low and current open markers — for intraday timeframes.
- MACD Red River — histogram with Bollinger Band envelope identifying momentum conditions.
Items 1–18 on the upper pane, item 19 (Red River) on the lower pane. Parameters are fractal — they work on every timeframe.
Main Chart Template Layout
The MainChart.Light layout sets up the standard chart template with our standard indicators described below. The main indicators are:
1,2: RL10 with MACD season color coding
3,4,5: Rl30, RL90 and RL270
6,7,8,9: Bollinger Band Mean, Z1, Z2 and Z3
10: PSAR
11,12: Dragon, Baby Dragon.
13,14: VWAP, Vol At Price
15,16,17, 18: Open of Day, Previous day close, high and low (for intraday trading)
19: MACD Red River and histogram
Light stands for light mode. For fans of dark mode, there is a MainChart.Dark Layout.
Main Chart Template Layout
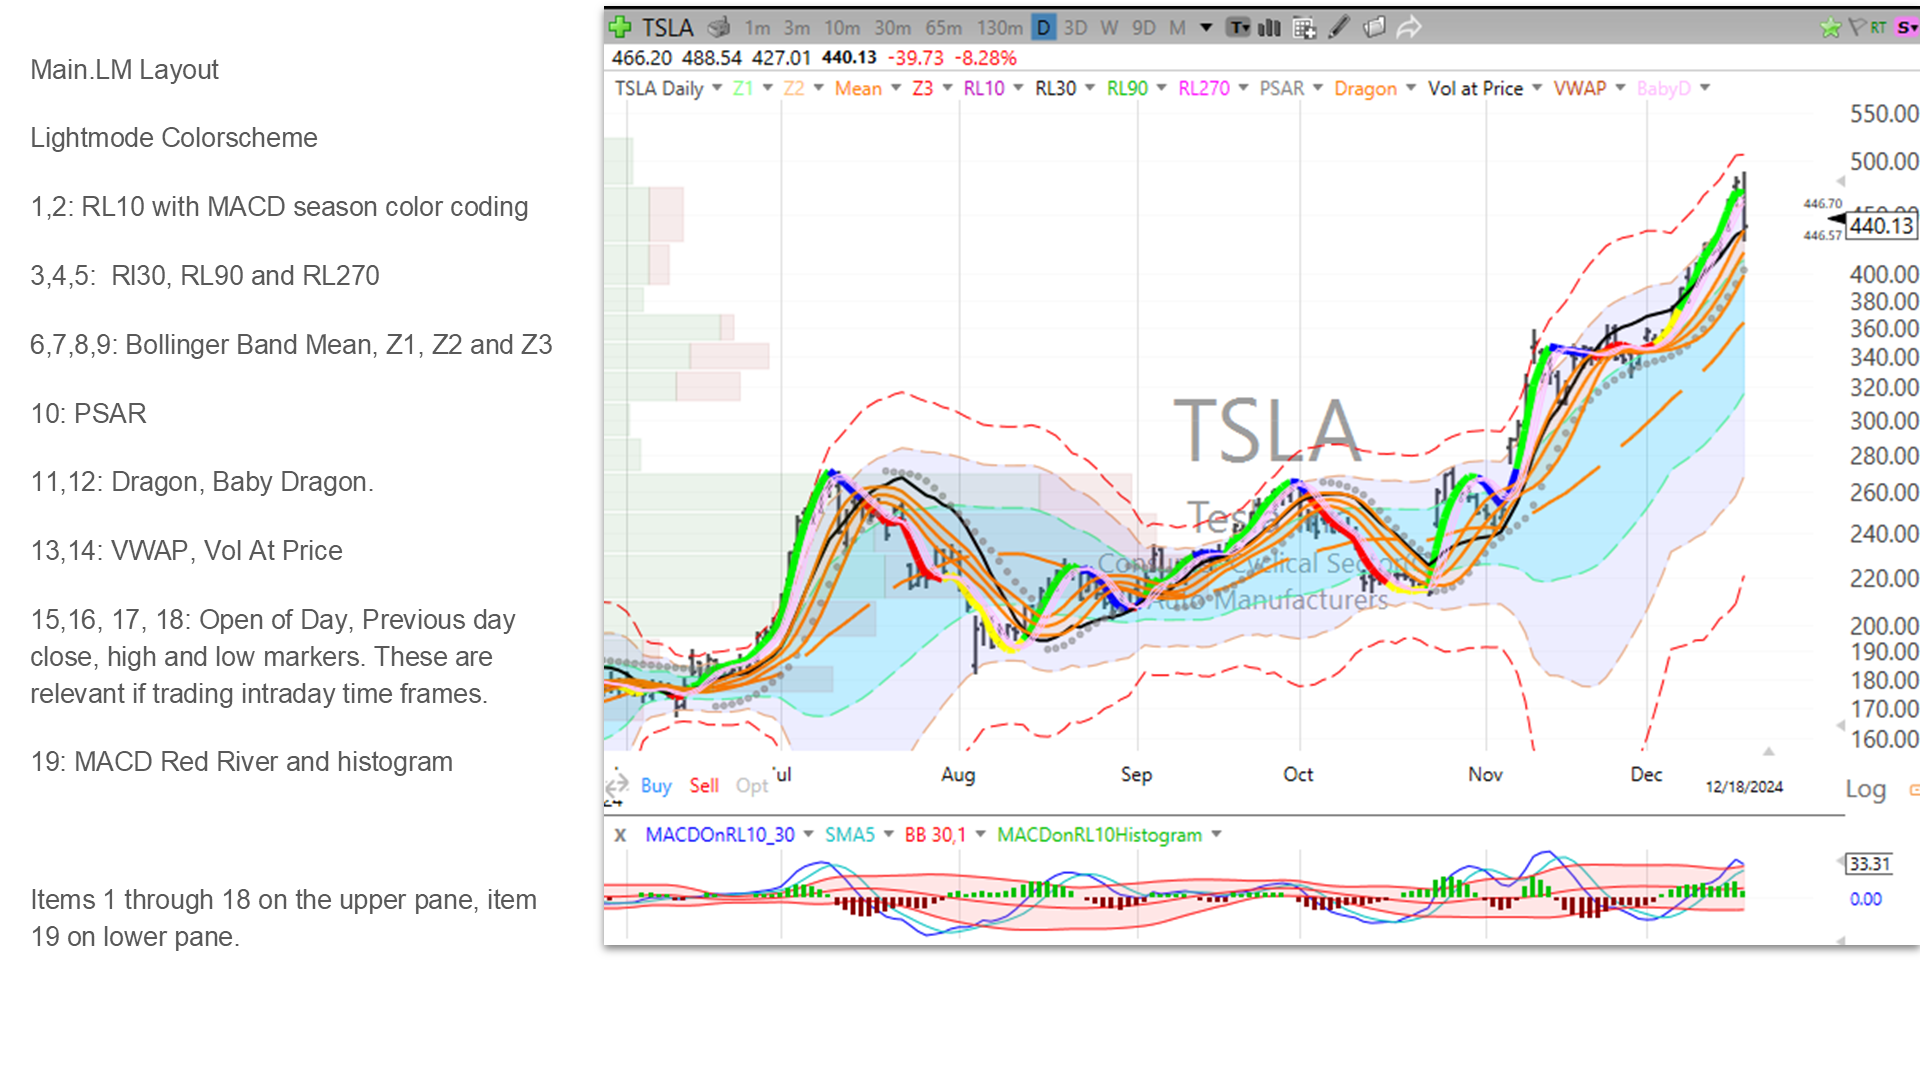
The MainChart.LM layout sets up the standard chart template with our standard indicators described below. The main indicators are:
1,2: RL10 with MACD season color coding
3,4,5: Rl30, RL90 and RL270
6,7,8,9: Bollinger Band Mean, Z1, Z2 and Z3
10: PSAR
11,12: Dragon, Baby Dragon.
13,14: VWAP, Vol At Price
15,16,17, 18: Open of Day, Previous day close, high and low (for intraday trading)
19: MACD Red River and histogram
LM stands for light mode. For fans of dark mode, there is a MainChart.DM Layout.
1,2: RL 10 with MACD Season Color Coding
RL10 is a 10 period Moving Regression Line indicator. Its color is derived from the the four seasons of the MACD indicator using a value of 10, 30, 5 for the slow, fast and EMA parameters.
The four seasons are calculated and color coded as follows:
Winter (Red): MACD line is below Zero and falling.
Spring (Yellow): MACD line is below Zero and rising.
Summer (Green): MACD line is above Zero and rising.
Fall (Blue): MACD line is above Zero and falling.
3. RL30
RL30 (Black solid line in light mode, White solid line in dark mode) is the 30 period moving linear regression.
RL10 is a proxy for the price of the symbol. RL30 is a proxy for the health of the trend.
This RL10 crossing down through RL30 signals an end of the bullish trend or start of a bearish trend, while RL10 crossing up through RL30 signals start of a bullish trend or the end of a bearish trend.
4,5. RL90 and RL270
RL90 (Blue solid line in both color modes) is the 90 period moving linear regression while RL270 (Teal solid line in both color modes) is the 270 period moving linear regression line.
RL90 and RL270 are used to interpret trends in higher time frames.
6. BB Mean
The Mean, also called the BB Mean, is the 30 period simple moving average (dashed orange color in both color modes).
7. Z1
Z1 which stands for zscore of 1 the shaded area surrounding the mean. It is the Bollinger Bandwidth of 30 period and 1 standard deviation wide (shading of the envelope in light mode is Teal, in dark mode is light purple).
This is also called the “River”. The middle of the river is the 30 period SMA.
8,9. Z2 and Z3
Similar to Z1, Z2 is the Bollinger Band with a standard deviation of 2 (shaded as mauve in light mode and magenta in dark mode). Z2 envelope is also called the “FloodPlain”. The middle of the floodplain is the 30 period SMA.
Z3 is the Bollinger band with a standard deviation of 3 (is shown with the dashed red line without any shading fill).
We will often refer to Z1, Z2 and Z3 as shorthand for price excursion from the mean.
Z2 is abnormal excursion while Z3 is extreme excursion.
10. PSAR
The Parabolic SAR indicator is applied to the RL10 data series (with parameter values of 0.02 and 0.14).
The PSAR indicator signals turning points of RL10, which is our proxy for price and thus it signals turning points in the trend.
11. The Dragon Indicator
The Dragon (plotted as three orange lines with light orange fill). The centerline of the Dragon is the 10 period simple moving average of the RL10. The two bands are the Bollinger Band values at 0.5 Standard Deviation. The center line is called the spine of the dragon, while the northern band is called the skin of the dragon, the southern band is called the belly of the dragon.
The Dragon acts as a noise barrier between the RL10 (which, remember is the proxy for our price) and the PSAR (which if crossed by the RL10, signals a change in trend).
We watch the crossing of the RL10 with the Dragon to preserve profits and exit, or get ready to enter.
12. The Baby Dragon Indicator
The Baby Dragon is an optional indicator. It is the 3 period simple moving average of the RL10. Looks similar to the Dragon (plotted in pink color). It is the first one to signal a trend reversal, but also susceptible to false signals. Use this for profit preservation.
13, 14. VWAP, Vol At Price
Volume Weighted Average Price is plotted with dashed dark orange color.
Volume at Price are the bars on the left. Green for positive bars, Red for Selling bars.
Both are standard indicators in TC2000.
15, 16, 17, 18: Previous day Close, High, Low and Open of the Day Markers
Previous day close, High, Low, Current Day Open markers. These are standard options on price in TC2000. We turn them on when trading on intraday time frames.
19. Red River and MACD Histogram
A MACD histogram with 10, 30, 5 parameters is used as a data source for a Bollinger Band of 1 standard deviation plotted as a ‘Red River’.
A green uptick on the MACD histogram is bullish provided the green MACD line is above and outside the upper band of the red river. The bullish trend is over as the MACD line enters back into the red river.
A red downtick on the MACD histogram is bearish provided the MACD line is below and outside the lower band of the red river. The bearish trend is over if the MACD line enters back into the red river.
Note that there are two different scales being used to make it easier to visualize the changes.
Summary of Parameters
Regression lines: 10, 30, 90 and 270.
Bollinger Band: 30 period for mean, 1, 2 and 3 Standard Deviations for Z1, Z2 and Z3.
PSAR: 0.02 and 0.14 for AF increase and AF Max.
MACD: 10, 30 and 5.
Dragon: 10 period SMA on RL10 and 0.5 Standard Deviation Bollinger Band Envelope.
Baby Dragon: 3 period SMA on RL10 and 0.5 Standard Deviation Bollinger Band Envelope.