MACD Zscore
ProductionMACD in z-score format for mean reversion scanning.
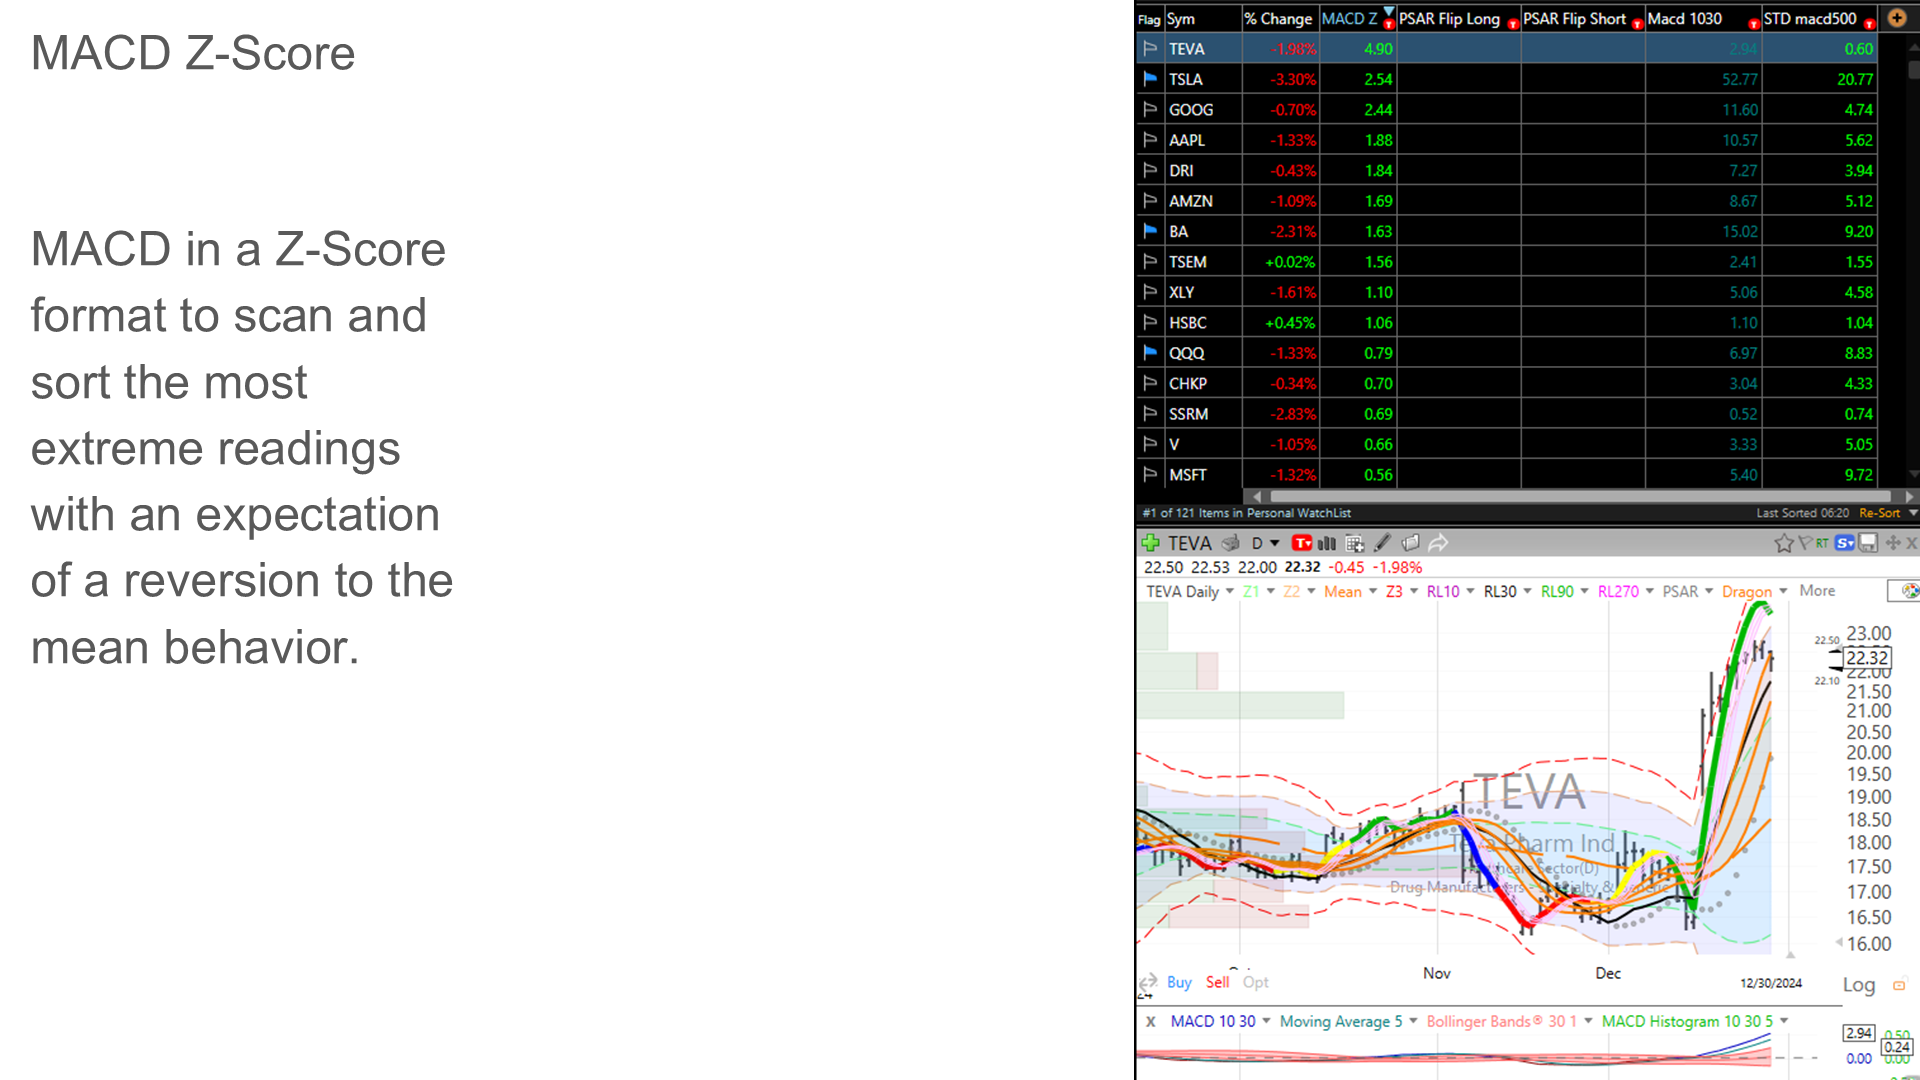
MACD Z-Score
MACD in z-score format to scan and sort the most extreme readings, with expectation of reversion to the mean.
- MACD Z-Score calculated using 30-period lookback.
- Histogram shows MACD Z-Score values.
- Area chart shows z-score of closing prices (CloseZ).
- RL10 crossing up SMA30 shown as yellow up bar; crossing down as orange bar.
Dark and light mode chart templates provided.
MACD Zscore Layout | LifelongEdge
MACD Zscore Layout
Targeting Essentials
TargetingEssentials
MACD Z-Score is calculated using a 30 period lookback to create the Z Score. Also plotted are the Z-Score of closing prices CloseZ, and the crossing of the RL10 with the SMA30.
Chart templates with both, dark mode and light mode are provided. Delete the chart template you don’t use.
In the indicator below, the histogram is the MACD Z-Score.
Area chart is z-score of closing price named CloseZ.
RL10 crossing up SMA30 is shown with a yellow up bar; Crossing down is the orange bar.